Cover of higher education & research in France, facts and figures

📄 Source:MENESR-DGESIP/DGRI-SIES.

 Coverage:Whole of France.

The Student Monitoring Information System (Système d’information pour le suivi des étudiants – SISE) stores students' enrolment forms (including those of students who subsequently never attended the course or who left early on) and examination results.

The study on pass rates for Bachelor's degrees (Licences) was based on cohorts of students starting the first year of a Licence programme for the first time. They were monitored over a five-year period, making it possible to estimate the pass rate for Licences for each cohort.

The pass rate for vocational Bachelor's degrees (Licences professionnelles - LPs) is a longitudinal indicator. It is calculated based on a cohort of students who enrolled for this course for the first time in the 2010-11 academic year and were subsequently monitored for the next two years. Data on what courses students had taken the previous year was obtained from the SISE and academic files of those who enrolled in the 2009-10 academic year.

The proportion of those who enrolled on the first year of a Master's degree and went on to obtain their degree in two or three years was calculated by monitoring for three consecutive years a cohort of students who enrolled on the first year of a Master's degree programme in the 2009-10 academic year.

The study covered all French universities (including the University of Lorraine, which has been granted grand établissement legal status) and university centres for education and research (Centres universitaires de formation et de recherche – CUFR).

Quick access

Share


For a better experience of this site, take the time to update your browser.
 

17 student trajectories and pass rates at universities

This page has been updated. Read 19. student trajectories and pass rates in university bachelor's degrees, vocational bachelor's degrees and master's degrees in Higher education & research in France, facts and figures 10th edition - June 2017

Slightly fewer students who started the first year of a Bachelor's degree in 2009 obtained their degree in three years, compared with those who went into the first year in 2005 (-1.7%). However, the proportion of those obtaining a Bachelor's degree in 3 or 4 years remained stable at nearly 40%. 47% of students on Master's degree programmes obtained their degree in two years and 57% in three years, an increase of eight points in four years.

A study on the trajectories of a cohort of students who started the first year of a Bachelor's degree (Licence) in the 2009-10 academic year has shown that more than half of them were still enrolled on the Licence programme two years later (table 17.01). A third of them continued into the third year, while less than a quarter repeated the second or sometimes the first year. Four out of ten students were no longer enrolled on a university course by the third year of the study. However, this does not mean that they had stopped studying – they may have moved to an advanced technician’s section (Section de techniciens supérieurs – STS) or left to continue their studies at a school. Very few of them (around 4%) switched to another university course and those that did mostly moved to technology university institutes (Instituts universitaires de technologie – IUT).

The trajectories of students on Licence programmes varied significantly depending on their academic background. Two thirds of students with a general baccalauréat were still on the Licence programme three years after enrolling in the first year and nearly four in ten were enrolled in the third year of a Licence. Students with a technical or vocational baccalauréat were less likely to continue with their Licence (28% and 15% respectively). Only around 11% of those with technical baccalauréats and 4% with vocational baccalauréats enrolled in the third year of a Licence.

The analysis of the trajectories of students enrolled on Licence programmes shows that the number of students obtaining their degree in 3 years fell from 28% to 26% between the 2005 and 2009 cohorts. This fall was due to an increase in the proportion of students with technical or vocational baccalauréats and a drop in the pass rate for those with general baccalauréats. However, the number of students obtaining their Licence after four years remained stable at nearly 40%, as did the number of those passing after five years (44%) (table 17.02). The results varied significantly depending on the students' academic backgrounds: 33% of those with general baccalauréats obtained their Licence in three years, in comparison with only 7% and 3% (respectively) of those with technical and vocational baccalauréats. At the end of 5 years, these rates were 53%, 17% and 5% respectively.

The pass rate for students enrolled on vocational Bachelor's degree (Licence professionnelle - LP) programmes was high, with 88% obtaining their diploma in one year (chart 17.03). Those who were awarded technology university diplomas (Diplôme universitaire de technologie – DUT) achieved the best results, while those who had returned to studying after not being in education the previous year did the least well, although the pass rate still remained high (85%). At the end of two years, the pass rate for LPs rose to 90%.

Nearly three quarters of those who were awarded a general Licence went on to continue their university studies with a Master's degree (chart 17.04), although the situation varied between subject areas. 87% of law graduates and nearly 80% of science graduates went on to start a Master's degree. However, the proportion of students going on to study for a Master's degree was lower in other subject areas (between 64 and 71%).

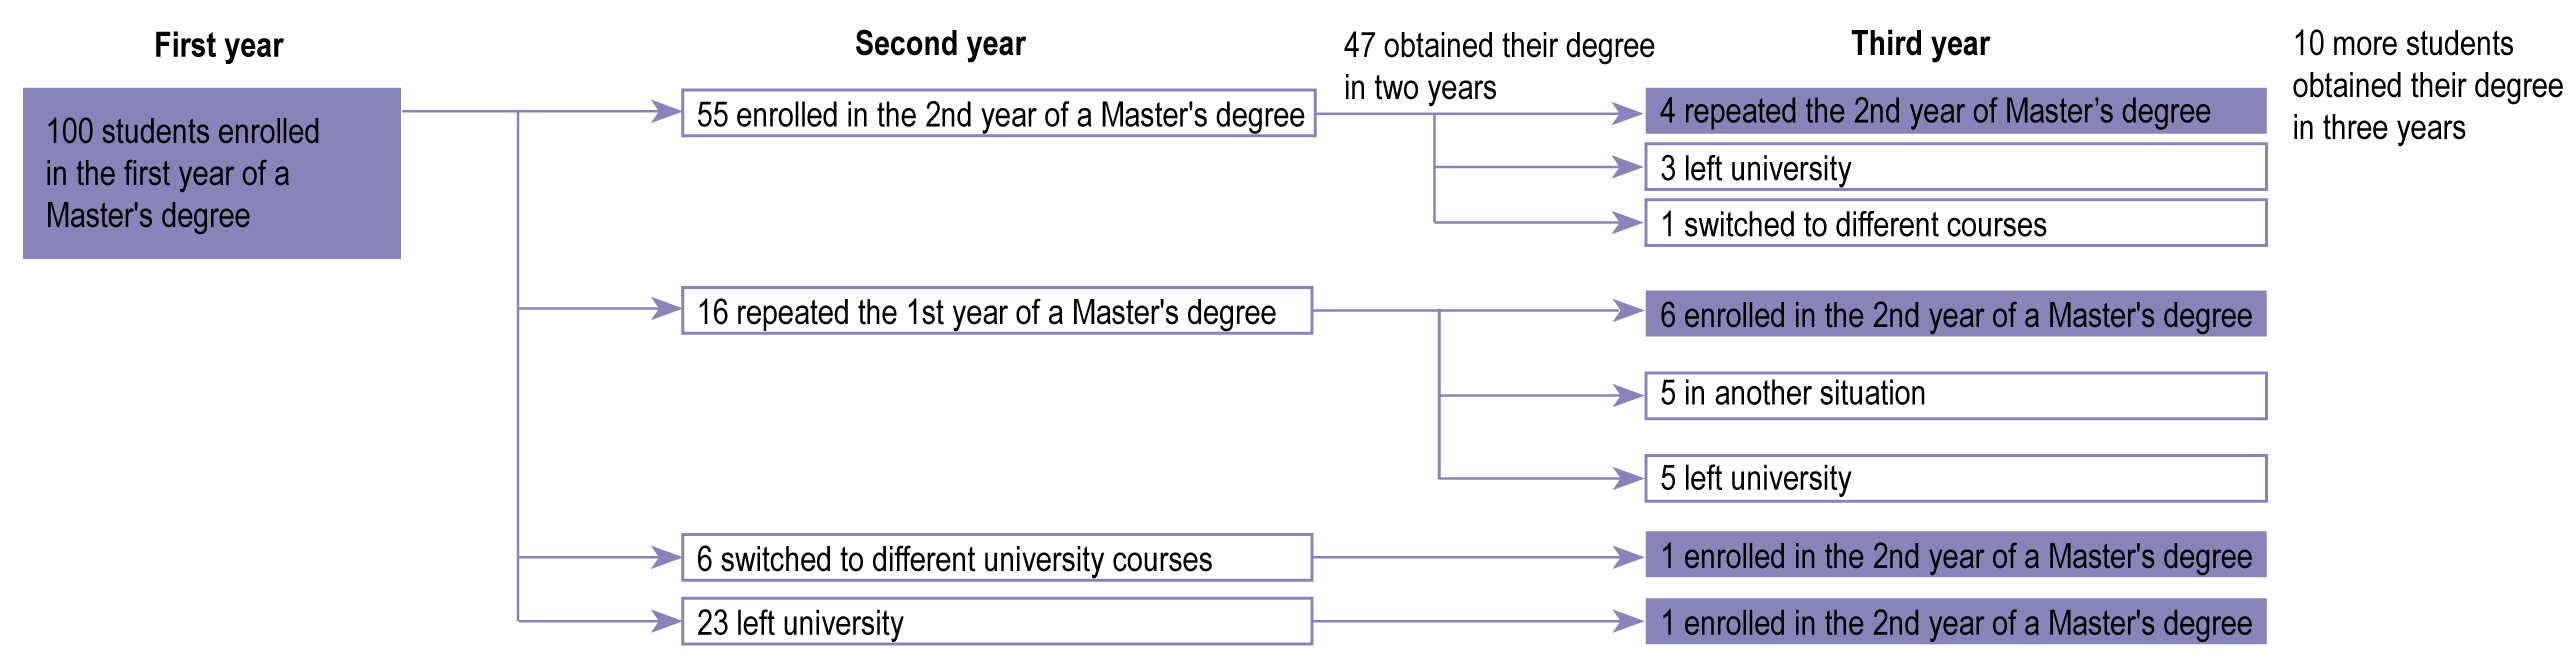
Of those students who enrolled in the first year of a Master's degree in the 2009-10 academic year, 55% continued into the second year and 16% repeated the first year (diagram 17.05). Others left the Master's degree programme, whether they had passed the first year or not. Some (6%) switched to different university courses, but most of them (23%) left university, either continuing their studies by different means or doing something else entirely. In total, 47% of the students who initially enrolled on Master's degree programmes obtained their degree in two years. 57% obtained their degree in three years, an increase of 8 points in comparison with those who had enrolled on the first year of a Master's degree programme in the 2005-06 academic year.

 Coverage:Whole of France.

How to cite this paper :

FOUQUET Samuel. Student trajectories and pass rates at universities. In: Higher education & research in France, facts and figures - 49 indicators [online]. KABLA-LANGLOIS Isabelle (dir.). Paris: Ministère de l'Éducation nationale, de l'Enseignement supérieur et de la Recherche, 2015. 8th ed. Chapter 17, 44-45 [Accessed 03/28/2024]. ISBN 978-2-11-139433-9. https://publication.enseignementsup-recherche.gouv.fr/eesr/8EN/EESR8EN_ES_17-student_trajectories_and_pass_rates_at_universities-ILL_04.php

close

Cite :   Share:          

The Student Monitoring Information System (Système d’information pour le suivi des étudiants – SISE) stores students' enrolment forms (including those of students who subsequently never attended the course or who left early on) and examination results.

The study on pass rates for Bachelor's degrees (Licences) was based on cohorts of students starting the first year of a Licence programme for the first time. They were monitored over a five-year period, making it possible to estimate the pass rate for Licences for each cohort.

The pass rate for vocational Bachelor's degrees (Licences professionnelles - LPs) is a longitudinal indicator. It is calculated based on a cohort of students who enrolled for this course for the first time in the 2010-11 academic year and were subsequently monitored for the next two years. Data on what courses students had taken the previous year was obtained from the SISE and academic files of those who enrolled in the 2009-10 academic year.

The proportion of those who enrolled on the first year of a Master's degree and went on to obtain their degree in two or three years was calculated by monitoring for three consecutive years a cohort of students who enrolled on the first year of a Master's degree programme in the 2009-10 academic year.

The study covered all French universities (including the University of Lorraine, which has been granted grand établissement legal status) and university centres for education and research (Centres universitaires de formation et de recherche – CUFR).


Key figures


Bachelor's degree pass rate in 3 years
27%
 
2007 cohort
Whole of France
 
See:   Embed:    Share:    
You can embeded this tile to your website or your blog by copying the HTML code and pasting it into the source code of your website / blog:
<iframe src='https://publication.enseignementsup-recherche.gouv.fr/eesr/8EN/CC-694-bachelor_s_degree_pass_rate_in_3_years.php' width='100%' height='155 px' frameborder='0' id='GC' scrolling='no' style='min-width:240px; max-width:490px'></iframe>
Extract from the chapter "17. student trajectories and pass rates at universities".

Source: MENESR-DGESIP/DGRI-SIES
Bachelor's degree pass rate in 3 or 4 years
39.3%
 
2007 cohort
Whole of France
 
See:   Embed:    Share:    
You can embeded this tile to your website or your blog by copying the HTML code and pasting it into the source code of your website / blog:
<iframe src='https://publication.enseignementsup-recherche.gouv.fr/eesr/8EN/CC-695-bachelor_s_degree_pass_rate_in_3_or_4_years.php' width='100%' height='155 px' frameborder='0' id='GC' scrolling='no' style='min-width:240px; max-width:490px'></iframe>
Extract from the chapter "17. student trajectories and pass rates at universities".

Source: MENESR-DGESIP/DGRI-SIES
Bachelor's degree pass rate in 3, 4 or 5 years
44.5%
 
2007 cohort
Whole of France
 
See:   Embed:    Share:    
You can embeded this tile to your website or your blog by copying the HTML code and pasting it into the source code of your website / blog:
<iframe src='https://publication.enseignementsup-recherche.gouv.fr/eesr/8EN/CC-696-bachelor_s_degree_pass_rate_in_3_4_or_5_years.php' width='100%' height='155 px' frameborder='0' id='GC' scrolling='no' style='min-width:240px; max-width:490px'></iframe>
Extract from the chapter "17. student trajectories and pass rates at universities".

Source: MENESR-DGESIP/DGRI-SIES
Vocational bachelor's degree pass rate in 1 year
88%
 
2011
Whole of France
 
See:   Embed:    Share:    
You can embeded this tile to your website or your blog by copying the HTML code and pasting it into the source code of your website / blog:
<iframe src='https://publication.enseignementsup-recherche.gouv.fr/eesr/8EN/CC-697-vocational_bachelor_s_degree_pass_rate_in_1_year.php' width='100%' height='155 px' frameborder='0' id='GC' scrolling='no' style='min-width:240px; max-width:490px'></iframe>
Extract from the chapter "17. student trajectories and pass rates at universities".

Coverage: enrolled in 2010-11
Source: MENESR-DGESIP/DGRI-SIES
  See more key figures  
Vocational bachelor's degree pass rate in 1 or 2 years
89.5%
 
2011 and 2012
Whole of France
 
See:   Embed:    Share:    
You can embeded this tile to your website or your blog by copying the HTML code and pasting it into the source code of your website / blog:
<iframe src='https://publication.enseignementsup-recherche.gouv.fr/eesr/8EN/CC-698-vocational_bachelor_s_degree_pass_rate_in_1_or_2_years.php' width='100%' height='155 px' frameborder='0' id='GC' scrolling='no' style='min-width:240px; max-width:490px'></iframe>
Extract from the chapter "17. student trajectories and pass rates at universities".

Coverage: enrolled in 2010-11
Source: MENESR-DGESIP/DGRI-SIES
Share of general Bachelor's degree graduates in 2011-2012 now doing a Master's degree or Master's in teaching
73%
 
2011-12
Whole of France
 
See:   Embed:    Share:    
You can embeded this tile to your website or your blog by copying the HTML code and pasting it into the source code of your website / blog:
<iframe src='https://publication.enseignementsup-recherche.gouv.fr/eesr/8EN/CC-699-share_of_general_bachelor_s_degree_graduates_in_2011_2012_now_doing_a_master_s_degree_or_master_s_in_teaching.php' width='100%' height='155 px' frameborder='0' id='GC' scrolling='no' style='min-width:240px; max-width:490px'></iframe>
Extract from the chapter "17. student trajectories and pass rates at universities".

Coverage: enrolled in 2011-12
Source: MENESR-DGESIP/DGRI-SIES
Master's degree pass rate in 2 years
47%
 
2007 cohort
Whole of France
 
See:   Embed:    Share:    
You can embeded this tile to your website or your blog by copying the HTML code and pasting it into the source code of your website / blog:
<iframe src='https://publication.enseignementsup-recherche.gouv.fr/eesr/8EN/CC-1047-master_s_degree_pass_rate_in_2_years.php' width='100%' height='155 px' frameborder='0' id='GC' scrolling='no' style='min-width:240px; max-width:490px'></iframe>
Extract from the chapter "17. student trajectories and pass rates at universities".

Source: MENESR-DGESIP/DGRI-SIES
Master's degree pass rate in 2 or 3 years
57%
 
2007 cohort
Whole of France
 
See:   Embed:    Share:    
You can embeded this tile to your website or your blog by copying the HTML code and pasting it into the source code of your website / blog:
<iframe src='https://publication.enseignementsup-recherche.gouv.fr/eesr/8EN/CC-1048-master_s_degree_pass_rate_in_2_or_3_years.php' width='100%' height='155 px' frameborder='0' id='GC' scrolling='no' style='min-width:240px; max-width:490px'></iframe>
Extract from the chapter "17. student trajectories and pass rates at universities".

Source: MENESR-DGESIP/DGRI-SIES

17.01 Progression by the third year of students who started the first year of a Bachelor's degree in 2009-2010, broken down by academic background (as a %)

 
General baccalauréat Technical baccalauréat Vocational baccalauréat All baccalauréats
Still on Bachelor's degree programme 62.9 27.7 14.7 53.3
3rd year of a Bachelor's degree (general or vocational) 37.8 10.5 3.8 30.6
2nd or 1st year of a Bachelor's degree 25.1 17.2 10.8 22.7
Switched to a different university course 4.3 2.3 0.8 3.7
to an IUT 2.4 1.7 0.4 2.2
to another university course 1.8 0.6 0.4 1.5
No longer enrolled at university 32.8 70.0 84.6 43.0
 

62.9% of students with a general baccalauréat were still enrolled on a Bachelor's degree programme by the third year of monitoring of this cohort. 37.8% were enrolled on the third year of a Bachelor's degree programme (either general or vocational).

 Coverage: Whole of France.

You can embed this table to your website or your blog by copying the HTML code and pasting it into the source code of your website / blog:

<iframe src="https://publication.enseignementsup-recherche.gouv.fr/eesr/8EN/illustration-EESR8EN_ES_17-0-progression_by_the_third_year_of_students_who_started_the_first_year_of_a_bachelor_s_degree_in_2009_2010_broken_down_by_academic_background_as_a.php" width="500px" height="700px" frameborder="0" id="EESR8EN_ES_17-0" scrolling="auto"></iframe>

close

Download:     Embed: <\>   Share:            

17.02 Changes in pass rates for Bachelor's degree programmes in three, four and five years (as a %)

 
Number of students
in cohort
Pass in 3 years
(in %)
Pass in 4 years
(in %)
Pass in 5 years
(in %)
2005 cohort 178,840 27.9 11.7 4.4
2006 cohort 172,200 27.9 11.5 4.7
2007 cohort 160,086 27.0 11.9 5.2
of which were students with baccalauréats 152,557 27.3 12.0 5.2
general 120,145 32.9 13.8 5.8
technical 25,713 7.3 6.2 3.6
vocational 6,699 2.7 1.9 0.8
2008 cohort 155,509 27.2 12.4 1
2009 cohort 168,468 26.2 1 1
 

1 The data for 2013 are not available, as results for this session have not yet been published.

 Coverage: Whole of France.

You can embed this table to your website or your blog by copying the HTML code and pasting it into the source code of your website / blog:

<iframe src="https://publication.enseignementsup-recherche.gouv.fr/eesr/8EN/illustration-EESR8EN_ES_17-1-changes_in_pass_rates_for_bachelor_s_degree_programmes_in_three_four_and_five_years_as_a.php" width="500px" height="700px" frameborder="0" id="EESR8EN_ES_17-1" scrolling="auto"></iframe>

close

Download:     Embed: <\>   Share:            

17.03 Proportion of students who enrolled in 2010-2011 and obtained a vocational Bachelor's degree in 1 or 2 years, broken down by the course they had taken the previous year (as a %)

DUT
Bachelor's degree
STS
Other university course
Not in education
Total
  
Pass in 1 year
Pass in 2 years
 
 
 Coverage: Whole of France.

You can embed this chart to your website or your blog by copying the HTML code and pasting it into the source code of your website / blog:

<iframe src="https://publication.enseignementsup-recherche.gouv.fr/eesr/8EN/illustration-EESR8EN_ES_17-2-proportion_of_students_who_enrolled_in_2010_2011_and_obtained_a_vocational_bachelor_s_degree_in_1_or_2_years_broken_down_by_the_course_they_had_taken_the_previous_year_as_a.php" width="500px" height="700px" frameborder="0" id="EESR8EN_ES_17-2" scrolling="auto"></iframe>

close

Download:     Embed: <\>   Share:            

17.04 Proportion of students awarded a general Bachelor's degree in 2011-2012 who went on to do a Master's degree or Master of Education, broken down by subject area of their Bachelor's degree (as a %)

Law
 
Economic and Social Administration
Languages
Life sciences, Health care, Earth sciences, Astrophysical sciences
Physical education and sports science and techniques
 
 
Economics
Humanities-Arts
Human sciences
Pure and applied sciences
 
Total
  
Proportion of Bachelor's graduates continuing on to a Master's degree (excluding Master of education) (as a %)
Proportion of Bachelor's graduates continuing on to a Master of Education (as a %)
 
 
 Coverage: Whole of France.

You can embed this chart to your website or your blog by copying the HTML code and pasting it into the source code of your website / blog:

<iframe src="https://publication.enseignementsup-recherche.gouv.fr/eesr/8EN/illustration-EESR8EN_ES_17-3-proportion_of_students_awarded_a_general_bachelor_s_degree_in_2011_2012_who_went_on_to_do_a_master_s_degree_or_master_of_education_broken_down_by_subject_area_of_their_bachelor_s_degree_as_a.php" width="500px" height="700px" frameborder="0" id="EESR8EN_ES_17-3" scrolling="auto"></iframe>

close

Download:     Embed: <\>   Share:            

17.05 Progression of students who enrolled on the first year of a Master's degree programme in 2009-2010 (as a %)

 Coverage: Whole of France.

You can embed this diagram to your website or your blog by copying the HTML code and pasting it into the source code of your website / blog:

<iframe src="https://publication.enseignementsup-recherche.gouv.fr/eesr/8EN/illustration-EESR8EN_ES_17-4-progression_of_students_who_enrolled_on_the_first_year_of_a_master_s_degree_programme_in_2009_2010_as_a.php" width="500px" height="700px" frameborder="0" id="EESR8EN_ES_17-4" scrolling="auto"></iframe>

close

Download: Embed: <\>   Share:            

Related statistical publications

 Note d'information SIES 14.05 - Student success according to financial difficulties and student allowances received - Nadine Laïb - July 2014
A quarter of baccalauréat holders from the 2008 session said they had experienced financial difficulties during their first year in higher education. The proportion was greater among students receiving grants. However, certain students who receive no financial support from their family and no grant are less likely to report financial difficulties because they live with their parents. A financial difficulty score is estimated for each student according to their social characteristics, income and housing situation. In addition to inequalities in terms of academic level, perceived financial difficulties can affect choices of direction after the baccalauréat, success in first year of higher education and the probability of obtaining a diploma more quickly.

For students of an equivalent academic level, those experiencing most financial difficulties are more likely to fail than the others. A study allowance reduces this risk of failure significantly.
 Note flash SIES 03 - Study paths and student success in university diplomas: indicators for the 2012 session - Samuel Fouquet - August 2014
This executive summary presents the main indicators for study paths followed by university students and their level of success: retention rate from first year to second year of the Bachelor's and Master's degrees, appeal of First and Second years of Master's, graduation rates for Bachelor's degrees, Master's degrees and Technological university diplomas delivered by the IUT (Diplôme universitaire de technologie - DUT).

In addition, these indicators are broken down by university. This information, published here for the second year running, will be disseminated every year. Results from the 2013 session should be available in February 2015.
 Note d'information SIES 13.10 - Success and failure in first cycle programmes - Samuel Fouquet - November 2013
The study path of students in first cycle programmes is marked by course changes and repeat years. In fact, only one in two students moves up directly from first year into the second year of the Bachelor's degree programme (one in four repeats the year and one in four changes course or gives up their higher education studies completely), while of those reaching the third year of the general Bachelor's degree programme, almost seven out of ten students obtain their diploma in just one year (nine out of ten for the vocational degree). For the University technology diploma delivered by the IUT (Diplôme universitaire de technologie - DUT), the number of students moving into the second year is high, with seven out of ten students. The pass rate in second year is also high: almost nine students out of ten obtained their diploma at the 2011 session. In Advanced technician’s sections (Section de technicien supérieur - STS), 85% of students move into second year. At the 2011 session, the pass rate for the Advanced technician diploma (Brevet de technicien supérieur - BTS) was 72%, two points higher than in 2010. These rates vary depending on the type of students and the type of institution in which they are studying. However, overall, if the definition of failure in the first cycle of study is the fact of leaving higher education with no diploma, then the failure rate in France is around 19%, ten points below the OECD average.
 Note d'information SIES 13.02 - Study paths and success in Bachelor's and Master's degrees at university - Samuel Fouquet - April 2013
27% of students entering university in the first year of a Bachelor's degree programme obtain their degree three years later and 12% of them take one extra year to finalise their degree. The age at which students obtained their baccalauréat, and above all the series of baccalauréat they took, are the factors that most affect their success in their degree course.

Other editions

Etat de l'enseignement supérieur et de la rechercheHigher education & research in France, facts and figures 10th edition - June 2017
19 - student trajectories and pass rates in university bachelor's degrees, vocational bachelor's degrees and master's degrees - Isabelle Maetz
At university, 27% of students obtain their Bachelor's degree 3 years after enrolling in the first year and 39% after 3 or 4 years. These rates have changed little in recent years. Nearly three-quarters of Bachelor's degree graduates enrol on a Master's the following year. Pass rates for Master's degrees have significantly increased since 2007; around 53% of students now obtain their degree in two years and 65% in two or three years [Consult the following page]
Etat de l'enseignement supérieur et de la rechercheHigher education & research in France, facts and figures 9th edition - November 2016
18 - student trajectories and pass rates in university Bachelor's degrees, vocational Bachelor's degrees and Master's degrees - Isabelle Maetz
At university, 28% of students obtain their Bachelor's degree 3 years after enrolling in the first year and 40% after 3 or 4 years. These rates have changed little in recent years. Nearly three-quarters of Bachelor's degree graduates enrol on a Master's the following year. Pass rates for Master's degrees have significantly increased since 2007; around 54% of students now obtain their degree in two years and 65% in two or three years [Consult the following page]

Translation

 Etat de l'enseignement supérieur et de la rechercheL'état de l'Enseignement supérieur et de la Recherche en France n°8 - juin 2015
17 - les parcours et la réussite en Licence, Licence professionnelle et Master à l'université - Samuel Fouquet
Les étudiants entrés en première année de Licence en 2009 obtiennent un peu moins souvent la Licence en trois ans que ceux entrés en 2005 (- 1,7 point). La réussite en 3 ou 4 ans, en revanche, reste stable, à près de 40 %. En Master, 47 % des étudiants obtiennent leur diplôme en deux ans et 57 % en trois ans, ce qui représente une hausse de huit points en quatre ans [Consult the following page in french]


Quick access

Share