Cover of higher education & research in France, facts and figures

📄 Sources:MENESR-DGESIP/DGRI-SIES
Insee
OECD.

 Coverage:Whole of France.

According to the Frascati manual, drawn up by the OECD, experimental research and development activities (R&D) cover creative work undertaken systematically in order to increase the stock of knowledge for new applications.

In order to measure total R&D expenditure, we can refer either to R&D performance or its funding by two key economic stakeholders: government and businesses. The term ‘government’ is understood here to cover government departments, public research institutions, higher education institutions and not-for-profit organisations. This definition is that used by the OECD.

Two main indicators are used:

gross domestic expenditure on research and development (GERD), which covers R&D carried out within France (metropolitan France and French overseas departments and territories), regardless of the source of funding;

gross national expenditure on research and development (GNERD), which covers funding from French businesses or government for R&D carried out in France or abroad.

These aggregates are obtained primarily from the results of annual surveys on resources dedicated to R&D by businesses and government. The data on R&D in France come from an annual survey carried out on each institutional sector, which was conducted in 2014 and 2015 for the 2013 financial year.

Changes in expenditure are measured in real terms, i.e. excluding price effects. Variations in R&D expenditure are estimated using the GDP deflator, i.e. the ratio of nominal GDP to real GDP. The method for calculating GDP was changed in May 2014 (GDP base year = 2010), (see chapter A7).

Quick access

Share


For a better experience of this site, take the time to update your browser.
 

26 Research and experimental development efforts in France

Gross domestic expenditures on experimental research and development (GERD) has grown at an average annual rate of 1.6% over the past 15 years. This growth was driven mainly by the dynamism of domestic R&D spending by enterprises (1.9% on average annually). GERD accounts for 2.24% of GDP in 2014, or 47.9 billion euros. The companies carry out 65% of the R&D work carried out on the national territory and finance 61% of the national R&D expenditure.

Overall expenditure on research and experimental development (R&D) is valued either in terms of funding by the French government and businesses, and performed mostly but not exclusively on French territory, or in terms of performance by the French government and businesses on French territory, taking into account foreign funding (see definitions).

In 2014, funding of R&D by French businesses or the government, known as gross national expenditure on R&D (GNERD), accounted for €51.4 billion, i.e. 2.40% of the country’s national wealth (GDP). In 2014, businesses were the main funders of R&D activities, funding 62% of GNERD (diagram 26.01).

In 2014, research and development (R&D) carried out in the national territory represented €47.9 billion in expenditure, or 2.24% of national wealth (GDP). In real terms, i.e. corrected by price effects, domestic expenditure on research and development (GERD) increased by 0.6% between 2013 and 2014. Businesses were responsible for 65% of this (table 26.02). By 2015, growth in GERD could reach +0.9% in volume, with spending on business (+1.1%) and government (+0.5%) increasing, but still lower than GDP (1.3%). Total GERD should reach €48.6 billion and R&D efforts should increase (2.23% of GDP).

Over the last 3 years, between 2011 and 2014, growth in research expenditure (+1.2% on average per year, in real terms) is greater than GDP by one point (+0.5%), thanks to the change in business expenditure (+1.7%). By contrast, the growth in government expenditure (0.2%) is lower than that of GDP (0.2%) (chart 26.03).

Over the last ten years, average annual growth in real terms between 2004 and 2014 in business GERD was higher than for the government (1.9% compared to 1.1%). The difference between business and government is even greater in terms of the change in GNERD with an average annual increase of 3.8% for business between 2004 and 2014, compared to 0.6% for government. Since 1995, the financial contribution of business has been greater than that of government (chart 26.04) but its share is a little below the average for OECD countries.

The difference between France’s total GERD and total GNERD represents the balance of R&D trade between France and other countries, including international organisations (table 26.02). In 2014, funding received from abroad and from international organisations (€3.7 billion) accounted for 8.0% of GERD financing. This was less than that spent by the French government and French businesses abroad (€7.2 billion). The government’s balance of trade with other countries was largely negative (-€1.3 billion). For companies, the balance, since 2012, is also negative (-€2.2 billion). The key international stakeholders, excluding major industrial groups such as Airbus Group, were the European Space Agency (ESA), the European Union (EU) and the European Organisation for Nuclear Research (CERN).

With 2.24% of GDP dedicated to domestic research in 2014, France did not meet the 3% target set by the EU as part of the Europe 2020 strategy or its own target, as part of the national research strategy (SNR). It ranked 5th among the OECD’s six largest countries in terms of GERD (chart 26.05), behind South Korea (4.3%), Japan (3.6%), Germany (2.9%) and the United States (2.7% in 2013), but ahead of the United Kingdom (1.7%), Italy and Spain. Within the EU, it was the countries with medium-sized economies that devoted the largest proportion of their GDP to R&D: Finland (3.2%) and Sweden (3.2%).

 Coverage:Whole of France.

How to cite this paper :

DAVID Catherine. Research and experimental development efforts in France. In: Higher education & research in France, facts and figures - 49 indicators [online]. KABLA-LANGLOIS Isabelle (dir.). Paris: Ministère de l'Éducation nationale, de l'Enseignement supérieur et de la Recherche, 2017. 10th ed. Chapter 26 [Accessed 03/29/2024]. ISBN 978-2-11-152033-2. https://publication.enseignementsup-recherche.gouv.fr/eesr/10EN/EESR10EN_R_26-research_and_experimental_development_efforts_in_france-ILL_03.php

close

Cite :   Share:          

According to the Frascati manual, drawn up by the OECD, experimental research and development activities (R&D) cover creative work undertaken systematically in order to increase the stock of knowledge for new applications.

In order to measure total R&D expenditure, we can refer either to R&D performance or its funding by two key economic stakeholders: government and businesses. The term ‘government’ is understood here to cover government departments, public research institutions, higher education institutions and not-for-profit organisations. This definition is that used by the OECD.

Two main indicators are used:

gross domestic expenditure on research and development (GERD), which covers R&D carried out within France (metropolitan France and French overseas departments and territories), regardless of the source of funding;

gross national expenditure on research and development (GNERD), which covers funding from French businesses or government for R&D carried out in France or abroad.

These aggregates are obtained primarily from the results of annual surveys on resources dedicated to R&D by businesses and government. The data on R&D in France come from an annual survey carried out on each institutional sector, which was conducted in 2014 and 2015 for the 2013 financial year.

Changes in expenditure are measured in real terms, i.e. excluding price effects. Variations in R&D expenditure are estimated using the GDP deflator, i.e. the ratio of nominal GDP to real GDP. The method for calculating GDP was changed in May 2014 (GDP base year = 2010), (see chapter A7).


Key figures


Gross national expenditure on R&D by business enterprises
31.7 bn
 
2014
Whole of France
 
See:   Embed:    Share:    
You can embeded this tile to your website or your blog by copying the HTML code and pasting it into the source code of your website / blog:
<iframe src='https://publication.enseignementsup-recherche.gouv.fr/eesr/10EN/CC-3057-gross_national_expenditure_on_r_d_by_business_enterprises.php' width='100%' height='155 px' frameborder='0' id='GC' scrolling='no' style='min-width:240px; max-width:490px'></iframe>
Extract from the chapter "26. Research and experimental development efforts in France".

Coverage: Current prices
Source: MENESR-DGESIP/DGRI-SIES
R&D effort (GERD as a % of GDP)
2.24%
 
2014
Whole of France
 
See:   Embed:    Share:    
You can embeded this tile to your website or your blog by copying the HTML code and pasting it into the source code of your website / blog:
<iframe src='https://publication.enseignementsup-recherche.gouv.fr/eesr/10EN/CC-3058-r_d_effort_gerd_as_a_of_gdp.php' width='100%' height='155 px' frameborder='0' id='GC' scrolling='no' style='min-width:240px; max-width:490px'></iframe>
Extract from the chapter "26. Research and experimental development efforts in France".

Source: MENESR-DGESIP/DGRI-SIES, Insee
Gross national expenditure on R&D by government
19.8 bn
 
2014
Whole of France
 
See:   Embed:    Share:    
You can embeded this tile to your website or your blog by copying the HTML code and pasting it into the source code of your website / blog:
<iframe src='https://publication.enseignementsup-recherche.gouv.fr/eesr/10EN/CC-3059-gross_national_expenditure_on_r_d_by_government.php' width='100%' height='155 px' frameborder='0' id='GC' scrolling='no' style='min-width:240px; max-width:490px'></iframe>
Extract from the chapter "26. Research and experimental development efforts in France".

Coverage: Current prices
Source: MENESR-DGESIP/DGRI-SIES
Intramural Government R&D expenditure
16.8 bn
 
2014
Whole of France
 
See:   Embed:    Share:    
You can embeded this tile to your website or your blog by copying the HTML code and pasting it into the source code of your website / blog:
<iframe src='https://publication.enseignementsup-recherche.gouv.fr/eesr/10EN/CC-3060-intramural_government_r_d_expenditure.php' width='100%' height='155 px' frameborder='0' id='GC' scrolling='no' style='min-width:240px; max-width:490px'></iframe>
Extract from the chapter "26. Research and experimental development efforts in France".

Coverage: Current prices
Source: MENESR-DGESIP/DGRI-SIES
  See more key figures  
Intramural business enterprise R&D expenditure
31.1 bn
 
2014
Whole of France
 
See:   Embed:    Share:    
You can embeded this tile to your website or your blog by copying the HTML code and pasting it into the source code of your website / blog:
<iframe src='https://publication.enseignementsup-recherche.gouv.fr/eesr/10EN/CC-3061-intramural_business_enterprise_r_d_expenditure.php' width='100%' height='155 px' frameborder='0' id='GC' scrolling='no' style='min-width:240px; max-width:490px'></iframe>
Extract from the chapter "26. Research and experimental development efforts in France".

Coverage: Current prices
Source: MENESR-DGESIP/DGRI-SIES
Share of Gross domestic expenditure on R&D executed by government
35%
 
2014
Whole of France
 
See:   Embed:    Share:    
You can embeded this tile to your website or your blog by copying the HTML code and pasting it into the source code of your website / blog:
<iframe src='https://publication.enseignementsup-recherche.gouv.fr/eesr/10EN/CC-3062-share_of_gross_domestic_expenditure_on_r_d_executed_by_government.php' width='100%' height='155 px' frameborder='0' id='GC' scrolling='no' style='min-width:240px; max-width:490px'></iframe>
Extract from the chapter "26. Research and experimental development efforts in France".

Source: MENESR-DGESIP/DGRI-SIES
Share of Gross domestic expenditure on R&D executed by firms
65%
 
2014
Whole of France
 
See:   Embed:    Share:    
You can embeded this tile to your website or your blog by copying the HTML code and pasting it into the source code of your website / blog:
<iframe src='https://publication.enseignementsup-recherche.gouv.fr/eesr/10EN/CC-3063-share_of_gross_domestic_expenditure_on_r_d_executed_by_firms.php' width='100%' height='155 px' frameborder='0' id='GC' scrolling='no' style='min-width:240px; max-width:490px'></iframe>
Extract from the chapter "26. Research and experimental development efforts in France".

Source: MENESR-DGESIP/DGRI-SIES
R&D effort (GERD as a % of GDP)
2.24%
 
2014
Whole of France
 
See:   Embed:    Share:    
You can embeded this tile to your website or your blog by copying the HTML code and pasting it into the source code of your website / blog:
<iframe src='https://publication.enseignementsup-recherche.gouv.fr/eesr/10EN/CC-3064-r_d_effort_gerd_as_a_of_gdp.php' width='100%' height='155 px' frameborder='0' id='GC' scrolling='no' style='min-width:240px; max-width:490px'></iframe>
Extract from the chapter "26. Research and experimental development efforts in France".

Source: MENESR-DGESIP/DGRI-SIES
  See more key figures  
Gross national expenditure on R&D
51.4 bn
 
2014
Whole of France
 
See:   Embed:    Share:    
You can embeded this tile to your website or your blog by copying the HTML code and pasting it into the source code of your website / blog:
<iframe src='https://publication.enseignementsup-recherche.gouv.fr/eesr/10EN/CC-3065-gross_national_expenditure_on_r_d.php' width='100%' height='155 px' frameborder='0' id='GC' scrolling='no' style='min-width:240px; max-width:490px'></iframe>
Extract from the chapter "26. Research and experimental development efforts in France".

Coverage: Current prices
Source: MENESR-DGESIP/DGRI-SIES
Gross domestic expenditure on R&D
47,919 M
 
2014
Whole of France
 
See:   Embed:    Share:    
You can embeded this tile to your website or your blog by copying the HTML code and pasting it into the source code of your website / blog:
<iframe src='https://publication.enseignementsup-recherche.gouv.fr/eesr/10EN/CC-3066-gross_domestic_expenditure_on_r_d.php' width='100%' height='155 px' frameborder='0' id='GC' scrolling='no' style='min-width:240px; max-width:490px'></iframe>
Extract from the chapter "26. Research and experimental development efforts in France".

Coverage: at current prices
Source: MENESR-DGESIP/DGRI-SIES
Intramural Government R&D expenditure
16,786 M
 
2014
Whole of France
 
See:   Embed:    Share:    
You can embeded this tile to your website or your blog by copying the HTML code and pasting it into the source code of your website / blog:
<iframe src='https://publication.enseignementsup-recherche.gouv.fr/eesr/10EN/CC-3067-intramural_government_r_d_expenditure.php' width='100%' height='155 px' frameborder='0' id='GC' scrolling='no' style='min-width:240px; max-width:490px'></iframe>
Extract from the chapter "26. Research and experimental development efforts in France".

Coverage: at current prices
Source: MENESR-DGESIP/DGRI-SIES
Gross national expenditure on R&D
51,417 M
 
2014
Whole of France
 
See:   Embed:    Share:    
You can embeded this tile to your website or your blog by copying the HTML code and pasting it into the source code of your website / blog:
<iframe src='https://publication.enseignementsup-recherche.gouv.fr/eesr/10EN/CC-3068-gross_national_expenditure_on_r_d.php' width='100%' height='155 px' frameborder='0' id='GC' scrolling='no' style='min-width:240px; max-width:490px'></iframe>
Extract from the chapter "26. Research and experimental development efforts in France".

Source: MENESR-DGESIP/DGRI-SIES
  See more key figures  
Gross domestic expenditure on R&D
48,643 M
 
2015
Whole of France
 
See:   Embed:    Share:    
You can embeded this tile to your website or your blog by copying the HTML code and pasting it into the source code of your website / blog:
<iframe src='https://publication.enseignementsup-recherche.gouv.fr/eesr/10EN/CC-3069-gross_domestic_expenditure_on_r_d.php' width='100%' height='155 px' frameborder='0' id='GC' scrolling='no' style='min-width:240px; max-width:490px'></iframe>
Extract from the chapter "26. Research and experimental development efforts in France".

Coverage: at current prices
Source: MENESR-DGESIP/DGRI-SIES
Intramural business enterprise R&D expenditure
31,133 M
 
2014
Whole of France
 
See:   Embed:    Share:    
You can embeded this tile to your website or your blog by copying the HTML code and pasting it into the source code of your website / blog:
<iframe src='https://publication.enseignementsup-recherche.gouv.fr/eesr/10EN/CC-3070-intramural_business_enterprise_r_d_expenditure.php' width='100%' height='155 px' frameborder='0' id='GC' scrolling='no' style='min-width:240px; max-width:490px'></iframe>
Extract from the chapter "26. Research and experimental development efforts in France".

Coverage: at current prices
Source: MENESR-DGESIP/DGRI-SIES

26.01 Funding and performance of R&D in France in 2014 1

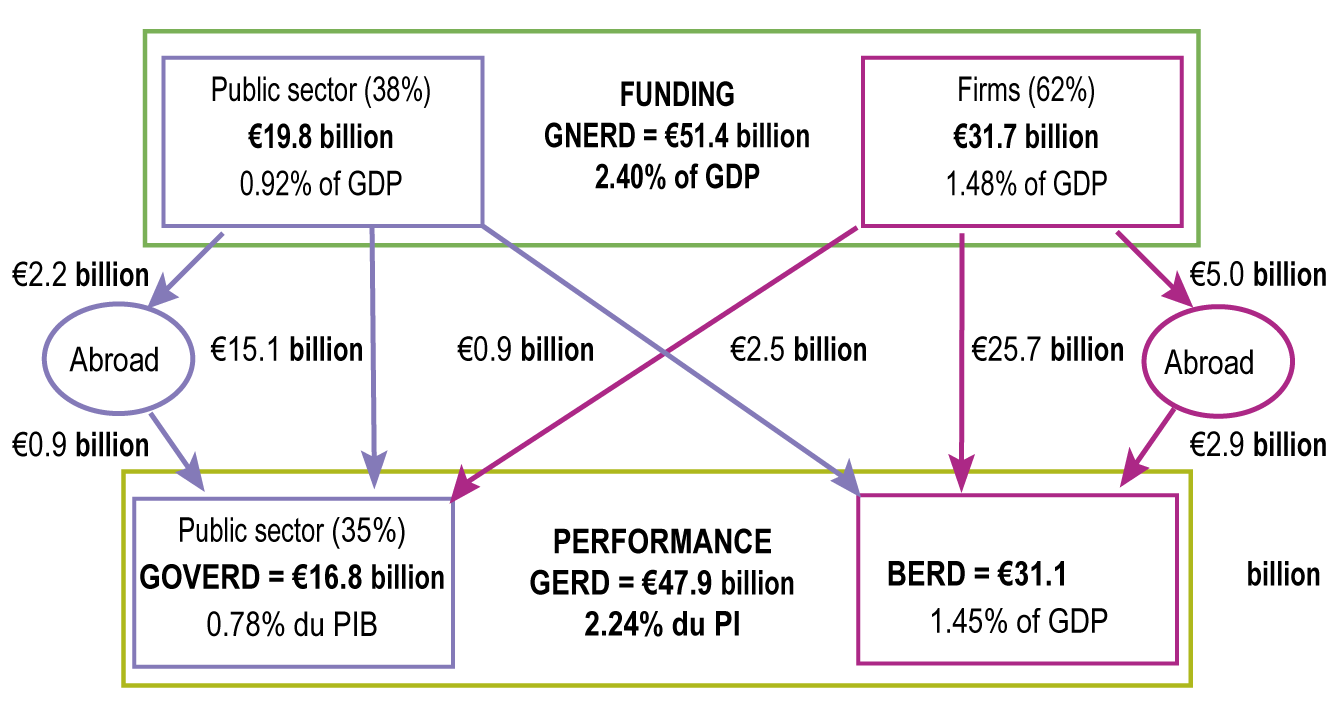
1 Semi-finalised results.

 Coverage: Whole of France.

You can embed this diagram to your website or your blog by copying the HTML code and pasting it into the source code of your website / blog:

<iframe src="https://publication.enseignementsup-recherche.gouv.fr/eesr/10EN/illustration-EESR10EN_R_26-0-funding_and_performance_of_r_d_in_france_in_2014_1.php" width="500px" height="700px" frameborder="0" id="EESR10EN_R_26-0" scrolling="auto"></iframe>

close

Download: Embed: <\>   Share:            

26.02 Funding and performance of R&D in France from 2011 to 2015

 
2011 2012 2013 3 2014 4 2015 5
Performance of R&D
GERD at current prices (€M) 45,112 46,519 47,362 47,919 48,643
at 2010 prices (€M) 44,690 45,557 46,025 46,321 46,724
as % of GDP 1 2.19 2.23 2.24 2.24 2.23
BERD as % of GERD 64.0 64.6 64.6 65.0 65.1
GOVERD  2 as % of GERD 36.0 35.4 35.4 35.0 34.9
Financement de la R&D
GNERD at current prices (€M) 46,474 48,537 49,377 51,417
at 2010 prices (€M) 46,039 47,533 47,983 49,703
as % of GDP 1 2.26 2.33 2.33 2.40
BERD in % of GNERD 58.9 59.5 59.0 61.6
GOVERD 2 in % of GNERD 41.1 40.5 41.0 38.4
International R&D trade
International R&D trade 3,495 3,534 3,735 3,732
Expenditure (in current €M) 4,857 5,552 5,750 7,230
Balance (in current €M) -1,362 -2,018 -2,015 -3,499
 

1 GDP in June 2014, change of methodology and 2010 as base year.
2 State and not-for-profit institutions (government, higher education and private non-profit sector).
3 Final results.
4 Semi-finalised results.
5 Estimates.
6 With regard to the external expenditure of enterprises, the data for 2014 incorporate a significant change in the declaration of a company which did not previously account for its R&D expenditure towards the other companies in its group. Developments at this level should be interpreted with caution.

 Coverage: Whole of France.

You can embed this table to your website or your blog by copying the HTML code and pasting it into the source code of your website / blog:

<iframe src="https://publication.enseignementsup-recherche.gouv.fr/eesr/10EN/illustration-EESR10EN_R_26-1-funding_and_performance_of_r_d_in_france_from_2011_to_2015.php" width="500px" height="700px" frameborder="0" id="EESR10EN_R_26-1" scrolling="auto"></iframe>

close

Download:     Embed: <\>   Share:            

26.03 Changes in the ratio of domestic expenditure on R&D to GDP (1981-2015)

GERD/GDP ratio
Changes in GDP in real terms
Changes in GERD in real terms
 
 
 Coverage: Whole of France.

You can embed this chart to your website or your blog by copying the HTML code and pasting it into the source code of your website / blog:

<iframe src="https://publication.enseignementsup-recherche.gouv.fr/eesr/10EN/illustration-EESR10EN_R_26-2-changes_in_the_ratio_of_domestic_expenditure_on_r_d_to_gdp_1981_2015.php" width="500px" height="700px" frameborder="0" id="EESR10EN_R_26-2" scrolling="auto"></iframe>

close

Download:     Embed: <\>   Share:            

26.04 Changes in business and government GERD and GNERD (in €M at 2010 prices) (1981-2015)

  
BERD
GOVERD
GNERD Administration
GNERD Business


Break in series in 1999.
r Change of methodology, revised data.

 Coverage: Whole of France.

You can embed this chart to your website or your blog by copying the HTML code and pasting it into the source code of your website / blog:

<iframe src="https://publication.enseignementsup-recherche.gouv.fr/eesr/10EN/illustration-EESR10EN_R_26-3-changes_in_business_and_government_gerd_and_gnerd_in_em_at_2010_prices_1981_2015.php" width="500px" height="700px" frameborder="0" id="EESR10EN_R_26-3" scrolling="auto"></iframe>

close

Download:     Embed: <\>   Share:            

26.05 Gross domestic expenditure on R&D as a percentage of GDP in the main OECD countries in 2014 1

IL
 
JP
FI
DE
OECD 2
FR 4
NL
CA
RU
 
 
KR
TW
SE
US 5
CN
EU28 2
GB
IT
 
ES
  
BERD/GDP
GOVERD/GDP


1 The European System of Accounts (2008) now recommends that funds spent by economic agents on R&D should be counted as investments, whereas they were previously categorised as intermediate consumption. As a result, countries that adopted this standard have had to significantly revise their level of GDP upwards for the entire period. In this graph, only data for Japan have not been revised.
2 Estimates.
3 Excluding (all or part of) capital expenditure.
4 GDP not revised according to ESA 2008.
5 2013.

You can embed this chart to your website or your blog by copying the HTML code and pasting it into the source code of your website / blog:

<iframe src="https://publication.enseignementsup-recherche.gouv.fr/eesr/10EN/illustration-EESR10EN_R_26-4-gross_domestic_expenditure_on_r_d_as_a_percentage_of_gdp_in_the_main_oecd_countries_in_2014_1.php" width="500px" height="700px" frameborder="0" id="EESR10EN_R_26-4" scrolling="auto"></iframe>

close

Download:     Embed: <\>   Share:            

Related statistical publications

 Note d'information SIES 16.12 - Dépenses de recherche et développement en France - Résultats détaillés pour 2014 et premières estimations pour 2015 - Philippe Roussel, Camille Schweitzer - December 2016
En 2014, la dépense intérieure de recherche et développement (DIRD) s’établit à 47,9 milliards d’euros (Md€), en hausse de 0,6 % en volume par rapport à 2013. L’augmentation de la DIRD résulte de la progression des dépenses de recherche et développement (R&D) des entreprises (+ 1,2 %), mais est modérée par une légère diminution des dépenses des administrations (- 0,4 %). Les activités de R&D dans les entreprises et les administrations mobilisent 417 200 personnes, en équivalent temps plein. L’effort de recherche de la nation, mesuré en rapportant la DIRD au produit intérieur brut (PIB), se maintient à 2,24 % en 2014. Il pourrait légèrement diminuer en 2015, pour atteindre 2,23 %. En effet, l’évolution de la DIRD devrait accélérer (+ 0,9 % en volume, estimation) grâce à la progression de la DIRD des entreprises et des administrations, mais moins rapidement que le PIB (+ 1,3 %).
 Note flash SIES 14 - Panorama de l'effort de R&D dans le monde - Claudette-Vincent Nisslé - November 2016
Les données sont issues de la base de données « Principaux indicateurs de la science et de la technologie » de l’OCDE. Les comparaisons quantitatives doivent rester prudentes en raison de problèmes de mesurabilité : correction des différences de niveaux de prix entre les pays, respect des recommandations des manuels de références de l’OCDE et des consignes établies par Eurostat. En outre, le Japon, la Russie et la Chine n’ont pas adopté le nouveau système de comptes nationaux qui, depuis 2014, inclut les dépenses de R&D dans le PIB.
 Note flash SIES 11 - Les dépenses intérieures de R&D en 2014 - Christophe Dixte, Anna Testas - September 2016
En 2014, la dépense intérieure de recherche et développement (DIRD) s’établit à 47,9 milliards d’euros (Md€), soit une hausse de 0,6 Md€ par rapport à 2013. Corrigée de l’évolution des prix, la DIRD a progressé de 0,6 % en 2014. La DIRD des entreprises est en hausse de 1,2 % en volume, tandis que celle des administrations baisse de 0,4 %. L’effort de recherche, qui rapporte la DIRD au produit intérieur brut (PIB), se maintient à 2,24 % en 2014. Il a augmenté de 0,22 point depuis 2007.

En 2015, l’évolution de la DIRD devrait accélérer (+0,9 % en volume, après +0,6 % en 2014). La DIRD atteindrait 48,6 Md€. D’une part, la DIRD des entreprises maintiendrait son rythme de progression et augmenterait de 1,1 % en volume, pour atteindre 31,7 Md€. D’autre part, la DIRD des administrations augmenterait de 0,5 % en volume, et s’élèverait à 17,0 Md€. La hausse de la DIRD serait moins élevée que celle du PIB (+1,3 %). Ainsi, l’effort de recherche diminuerait légèrement, de 2,24 % à 2,23 %.
 Note flash SIES 03 - BERD up by 2.3% in 2014 - Florian Lezec - March 2016
In 2014, according to the provisional data, gross domestic expenditure on research and development by business enterprises established in France (BERD) amounted to €31.5 billion. When corrected by inflation, BERD was particularly dynamic, with an increase of 2.3% in one year. It increased at a faster rate than in 2013 when it experienced a slowdown (+1.4% in 2013 after +2.9% in 2012 and +4.1% in 2011). Against a background of virtual stability in Gross Domestic Product (GDP), business research effort, which is the ratio of GERD to GDP, increased again to reach 1.48% in 2014, compared to 1.45% in 2013.


Other editions

Etat de l'enseignement supérieur et de la rechercheHigher education & research in France, facts and figures 9th edition - November 2016
27 - research and experimental development efforts in France - Catherine David
France’s gross domestic expenditure on research and experimental development (GERD) has doubled since 1983 and accounted for 2.24% of GDP (€47.5 billion) in 2013. Businesses alone implemented 65% of R&D expenditure in France and funded 59% of gross national expenditure on R&D [Consult the following page]
Etat de l'enseignement supérieur et de la rechercheHigher education & research in France, facts and figures 8th edition - November 2015
26 - research and development efforts in France - Catherine David
France’s gross domestic expenditure on research and development has doubled since 1982 and accounted for 2.23% of GDP (€46.5 billion) in 2012. Businesses alone implemented 65% of R&D expenditure and funded 59% of gross national expenditure on R&D [Consult the following page]

Translation

 Etat de l'enseignement supérieur et de la rechercheL'état de l'Enseignement supérieur et de la Recherche en France n°10 - Avril 2017
26 - l'effort de recherche et développement en France - Catherine David
La dépense intérieure de recherche et développement expérimental (DIRD) a progressé à un rythme annuel moyen de 1,6  % depuis une quinzaine d’année. Cette croissance a été portée principalement par le dynamisme de la dépense intérieure de R&D des entreprises (1,9 % en moyenne annuelle). La DIRD représente 2,24 % du PIB en 2014, soit 47,9 milliards d’euros. Les entreprises exécutent 65 % des travaux de R&D réalisés sur le territoire national et financent 61 % de la dépense nationale de R&D [Consult the following page in french]


Quick access

Share