higher education and research in France, facts and figures - Summary
Every year, for 10 years, Higher Education and Research in France, Facts and Figures presents an overview, backed up by figures, of developments within the French system, its resources and outcomes. Wherever the data permit, an international comparison is provided. A double page is devoted to each theme (49 in total), including a summary of the main data available and several graphs and tables as illustrations. This publication relies on key national and international statistical sources providing data on higher education and research in France.
Spending on higher education increases moderately after a period of strong growth
In 2015, the French nation spent €30.1 billion on higher education, an increase of 0.2% in comparison with 2014 (at constant prices, i.e. adjusted for inflation). Expenditure on higher education has more than doubled since 1980 (by a factor of 2.6, at constant prices), increasing by an average of 2.7% a year. In 2015, average expenditure per student in higher education totalled €11,680. It is slightly higher than the average expenditure for a second-level pupil (11,190 euros in 2014). The average expenditure per student has decreased slightly since its maximum level reached in 2009, due in particular to the sharp increase in enrollments. Nonetheless, it remains nearly 40% higher than in 1980. However, the cost per student varied between different types of courses, ranging from €10,387 per year on average for students at State-run universities to €15,100 for those attending classes preparing for admission to Grandes Écoles (CPGE). This variation is explained in large part by the level of educational supervision provided.
Staffing costs accounted for more than two thirds of expenditure on higher education. At the start of the 2015-16 academic year, the teaching and research potential in public higher education institutions under the responsibility of the Ministry of Education, Higher Education and Research (MENESR) was 90,500 teachers, which included 56,400 teacher-researchers and equivalent, or 62% of all staff. Secondary teachers working in higher education and non-tenured teachers represented 14%% and 24% of the teaching workforce respectively. For 20 years, the number of teachers in higher education has increased by nearly 30%.
The French government provides the majority of funding for higher education, accounting for around 70% of financing in 2015, while households is somewhat lower than 10%. At the start of the 2015-16 academic year, 710,000 students benefited from direct financial aid in the form of grants or loans. Financial and social support for students, including accommodation subsidies and forms of tax relief, totalled €6.0 billion.
In 2013, France devoted 1.5% of its GDP to higher education, leaving it one tenth of a percentage point below the average for OECD countries (1.6%) and far behind the United States (2.6%), Canada (2.5%) and South Korea (2.3%).
Student enrollments are accelerating in recent years
633,500 of the candidates who sat examinations in 2016 were awarded a baccalauréat, equivalent to a pass rate of 88.6%. The proportion of people in a generation that hold a baccalauréat was over 60% in 1995 and rose to 78.6% in 2016.
Almost all of those with general baccalauréats and three-quarters of the technological baccalauréat holders were enrolled on higher education courses at the start of the 2015-16 academic year. Most of those with vocational baccalauréats went straight into employment, so the proportion of this group enrolling in higher education was lower. However, it has nonetheless risen sharply in ten years (to 36.7% in 2015, as compared with 17.1% in 2000, excluding work-study programmes). Nearly 75% of those who obtained a baccalauréat (of any kind) in 2015 went on to enrol on higher education courses immediately (excluding work-study programmes). A significant number, particularly among those with vocational baccalauréats, also continued on to higher education via work-study programmes.
Given the proportion of an age group that is now obtaining a baccalauréat, and the percentage that are continuing secondary education, it follows that nearly 60% of young people are now accessing higher education.
The Post-Bac Admission system centralises higher education course choices. More than 530,000 baccalauréat holders of the 2016 session submitted at least one course preference (7.6 preferences formulated on average). 60% of general baccalauréat holders, 50% of technological baccalauréat holders and 36% of vocational baccalauréat holders received an offer matching their first choice. Getting a first choice in a selective cursus is less common. 35% of general baccalauréat holders wanting to enter classes preparing for admission to Grandes Écoles (CPGE) therefore received their first choice. 41% of technological baccalauréat holders wanting to enter a University Technology Institute (IUT) and nearly equivalent for vocational baccalauréat holders requesting admission to an Advanced Technician's Section (STS) (38%).
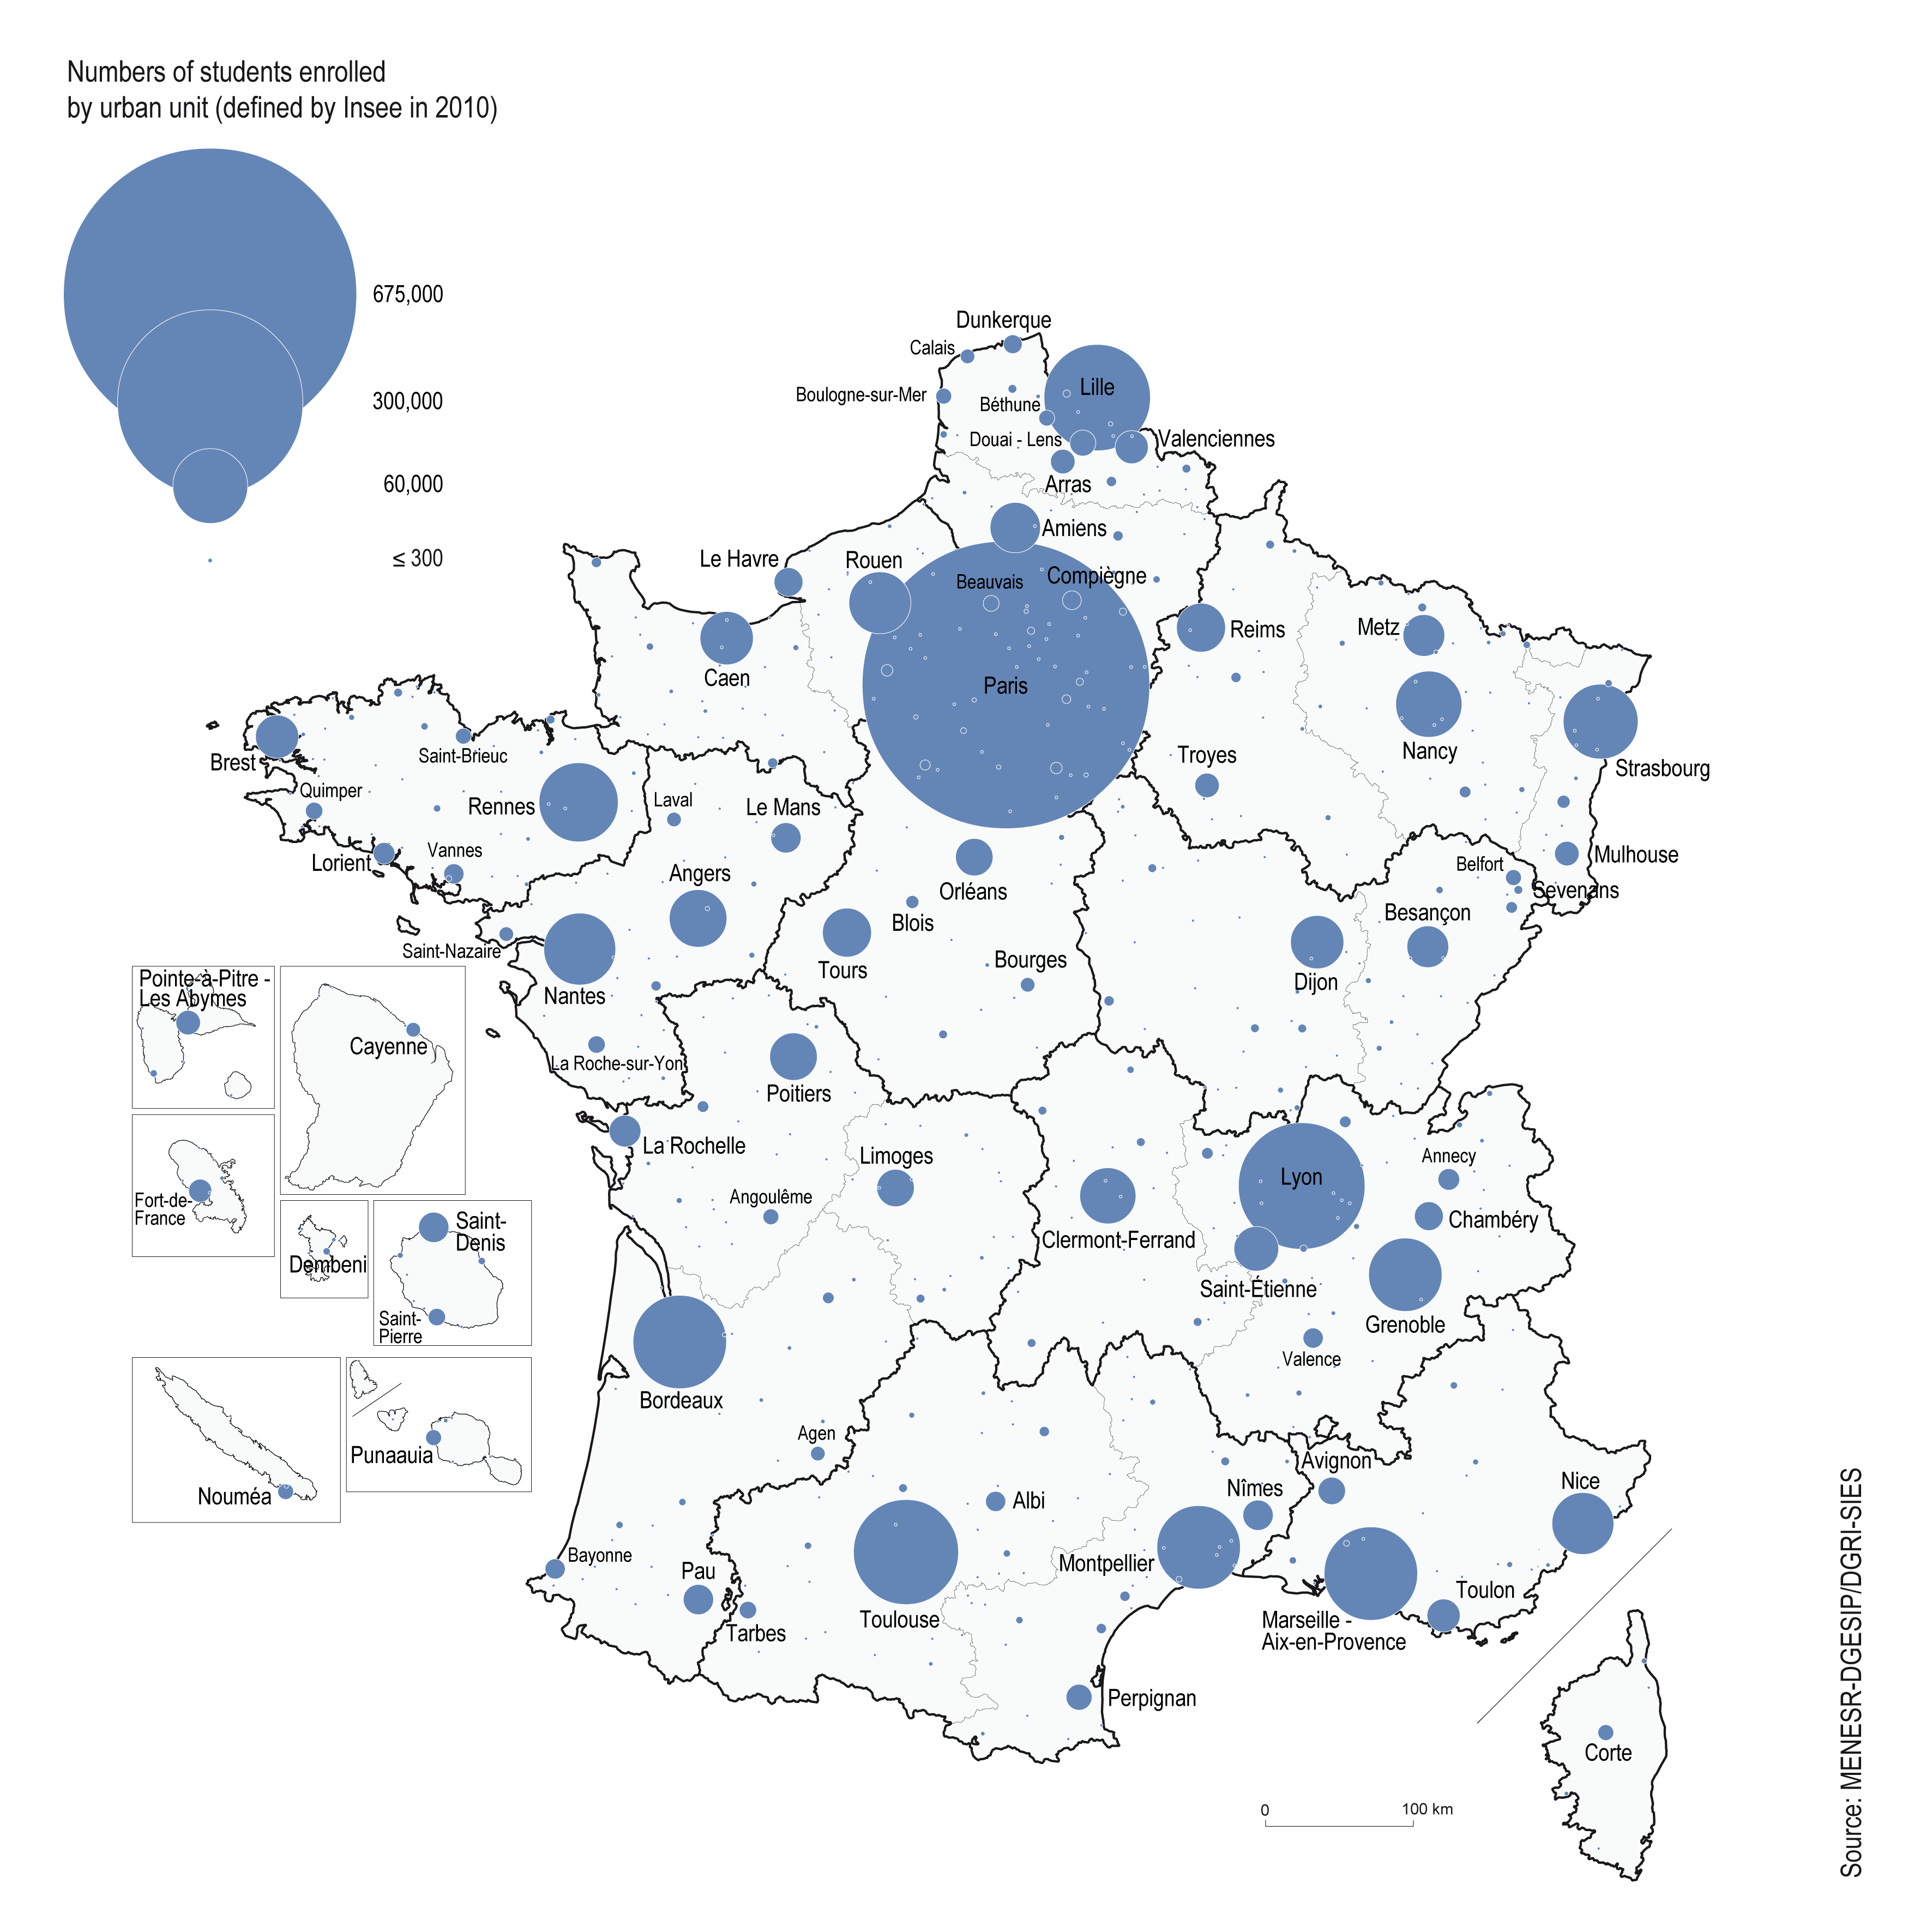
At the start of the 2015-16 academic year, 2,551,100 students were enrolled in higher education. Growth in numbers of baccalauréat graduates within an age group, appeal of higher education and demographic factors all contribute to on-going growth in student numbers, which has been even faster in the recent period. The number of new students has increased to 210,000 in the past five years alone. Private higher education has seen the greatest advancement in its student numbers since the early 2000s (+ 62% between 2000 and 2015).
The overwhelming majority of those with general baccalauréats go on to university, many of whom enrol on general or healthcare courses. The most popular choices other than university programmes are vocational short courses at University Technology Institutes (IUT) or Advanced Technician's Sections (STS) and CPGEs.
The appeal of university education varies significantly between different disciplines. Between 2005 and 2015, the number of students enrolled in Health training rose sharply (+15.0%) both during the period 2005-2010, marked by a certain slackness in student numbers, and between 2010 and 2015 (+10.0%), a period of general increase in the number of students. Progress is also strong in Law even though the past five years have a less dynamic profile Between 2010 and 2015, the scientific subjects and physical education and sports science and techniques (STAPS) saw the largest growth, whereas student numbers in these fields of education had settled at 2.5% between 2005 and 2010. Just like the Sciences and STAPS, the Arts and Human and Social Sciences have followed a clear path of significant decline in numbers followed by more than 10% growth in the recent period (2010-2015).
Work-study programmes were first introduced in 1987 and were expanded as part of reforms to the French higher education system (‘LMD reform’) in 2002, consequently becoming much more widespread in higher education. The number of apprentices almost doubled in about 10 years between 2005 and 2014. The increase was nevertheless lower in the recent period and the most recent measurement year was marked by stagnating numbers over the previous year. Apprentice numbers in level III training courses (especially higher technical certificate (BTS)) fell back, whilst level I courses (engineering degrees and Master’s) were still buoyant. The number reached 138,000 in 2014, accounting for 5.4% of all students in higher education and 34% of all apprenticeship. Nearly one apprentice in two prepares a BTS, and one in ten an engineering degree or a Bachelor's degree.
PhDs are the most advanced qualification awarded by higher education institutions and doctoral research contracts provide many PhD students with their first professional experience. PhD graduates are a key driving force behind research in France. Training through research has been provided by graduate schools since 2000. 41% of these are completed in less than 3 years. Nearly 14,500 PhDs were rewarded in 2015. The number of PhDs awarded increased by nearly 10.0% between 2009 and 2012, but fell by 1.7% between 2012 and 2015. Most of the PhDs awarded (more than 65%) were in scientific subjects (including Biology and Healthcare). At the start of the 2015-16 academic year, there were nearly 75,600 PhD students.
Variations in pass rates between different types of courses
The pass rates for certain higher education qualifications were strongly influenced by students’ academic backgrounds. This was true of general Bachelor’s degrees, University technology diplomas (DUT) and BTSs. Those with general baccalauréats were likely to do better on these courses than their counterparts with technological or vocational baccalauréats. However, the type of baccalauréat held by students had little influence on the pass rate for vocational Bachelor's degrees.
Only 45% of students on Bachelor’s degree programmes obtained their qualification in 3, 4 or 5 years. Nearly three quarters of those who were awarded a general Bachelor’s degree in 2015 stayed on at university the following year to do a Master’s degree (including Master's in Education). One in two Master's degree students were awarded their degree in two years, and one in ten in three years.
The pass rate is relatively high for short courses. Thus, nearly three-quarters of students registered initially in STS (Advanced Technician's Section) achieved a higher education diploma. In addition, data relating to the 2008 baccalauréat holders entering STS have shown that, despite nearly one in two of them only achieving a Bac + 2 level, 19% achieved a Bac + 3 qualification and 9% even a Bac + 5. The situation diverges depending on the type of baccalauréat held by the students. Among baccalauréat holders preparing for University technology diplomas (DUT) in 2008, the proportion of higher education qualifications after six full years was very high: 92%.
Two thirds of 2008 baccalauréat holders opting for classes preparing for admission to grandes écoles (CPGE) held Bac + 5 level qualifications after five or six years of study. Less than 10% of students following this initial path did not pursue their studies and left higher education without a qualification.
In 2014, 45% of young people aged between 25 and 34 held a higher education qualification, compared to an average of 41% in the OECD countries. However, nearly 75,000 young people every year leave higher education without obtaining any qualification.
Higher education is becoming more accessible to students from all social backgrounds and to women, but there remain significant differences between those from different social backgrounds, as well as between courses
The drive to make higher education more widely accessible continues: in 2014, 58% of those aged between 20 and 24 had attended higher education courses (regardless of whether they graduated), as compared with 33% of those aged between 45 and 49.
76.8% of those aged 20-24 who came from more privileged backgrounds and whose parents worked as managers or in middle management were studying or had studied at a higher education institution, compared to 61.1% of those aged between 45 and 49. This increase was slightly higher among those whose parents were manual workers or employees, but from a particularly low starting point: 43.7% of those aged 20-24 were studying or had studied at higher education institutions, compared with 23.4% of those aged between 45 and 49.
There is thus still a gap of almost one to two between the two social groups in terms of access to higher education. This also holds true for qualifications: on average, over the period 2013-2015, 74% of those whose parents worked as managers or in middle management held a higher education qualification, compared with 38% of those whose parents were manual workers or employees.
Although there was little distinction in terms of social background on technological short courses, such as BTS and DUT, divisions were much more noticeable in the case of universities (excluding IUTs) and Grandes Écoles. 33% of those whose parents worked as managers graduated from a Grande École or university with a baccalauréat + 5 years-level or higher qualification, compared with only 8% of those whose parents were manual workers.
More than half of students (55%) are women. Women make up the vast majority (70%) of those studying Arts or Human Sciences subjects, as well as paramedical and social care courses (84%). However, they are in the minority when it comes to the most selective courses, such as CPGEs and IUTs, and still account for only a very small proportion of students on Science courses. In 2015-16, just over a quarter of students (27%) at engineering schools were women. The proportion of women doing apprenticeships is also low (39%).
Women account for a larger share of the student population and more women hold qualifications than men. Half of all women who left initial education between 2012 and 2014 had obtained a higher education qualification, compared to only 40% of men. Women with higher education qualifications are more likely to hold a baccalauréat + 5 years-level university qualification, whereas men are more likely to obtain qualifications from specialist schools and short vocational courses (BTS or DUT). The labour market is less favourable for women and their access to employment is slower. They are less likely to have permanent employment contracts and more likely to work part time. More specifically, 3 years after leaving higher education, a quarter of women are employed as managers, compared with more than a third of men.
Over the past 20 years, the number of women working as teacher-researchers has increased. In 2015-16, women held 44.2% of all lecturing positions, but still only accounted for 24.0% of university professors.
In a difficult economic context, a higher education qualification remains an advantage in getting a job and pursuing a career
Those leaving higher education enjoy more favourable conditions in accessing the labour market than other applicants, particularly in times of crisis. However, they experienced a downturn in their integration conditions. 13% of 2013 graduates were thus unemployed three years after leaving higher education. This is double the figure experienced by those who graduated before them in 2001, three years after entering the labour market.
Increased funding for R&D against a backdrop of intense global competition
In 2014, France’s gross domestic expenditure on R&D (GERD) totalled €47.9 billion, equivalent to 2.24% of the country’s gross domestic product (GDP), putting it behind South Korea (4.3%), Israel (4.1%), Japan (3.6%), Germany (2.9%) and the United States (2.7%), but ahead of the United Kingdom (1.7%). GERD is expected to reach €48 billion (2.23% of GDP) in 2015.
The research effort came largely from businesses, which carried out 65% of all R&D conducted in France in 2014, a total amount of €31 .6 billion, and financed 62% of this work. Public sector GERD totalled €16.9 billion in 2014, with R&D carried out in large part by dedicated research institutions (54%), as well as higher education institutions (46%). SMEs contributed 13% of GERD, more than half of which was invested in the service sector. Large enterprises, which accounted for 58% of GERD, focused three quarters of their funding on high and medium-high technologies. More than 54% of all intramural BERD went towards six industry groups: ‘Manufacture of motor vehicles’, ‘Manufacture of air and spacecraft and related machinery’, ‘Manufacture of basic pharmaceutical products and pharmaceutical preparations’, 'Specialised scientific and technical activities', ‘Computer-related and information service activities’, 'Manufacture of chemicals and chemical products'. Businesses also devoted a considerable proportion of their intramural BERD to multidisciplinary fields such as new materials, nanotechnology, digital , biotechnology and environment.
In 2014, 7% of all business R&D was government-funded and the amount of CIR paid out (for R&D, innovation and collections) totalled €5.7 billion in 2013. In this regard, France is no different from other OECD countries, where tax incentives are increasingly being used to promote R&D in the private sector, reflecting the more intense competition between different countries when it comes to attracting firms’ R&D divisions. Local authorities also contribute to the research effort, often by financing property transactions and technology transfers. The 2014 research and technology transfer (R&T) budget for local authorities was estimated to be €1.3 billion.
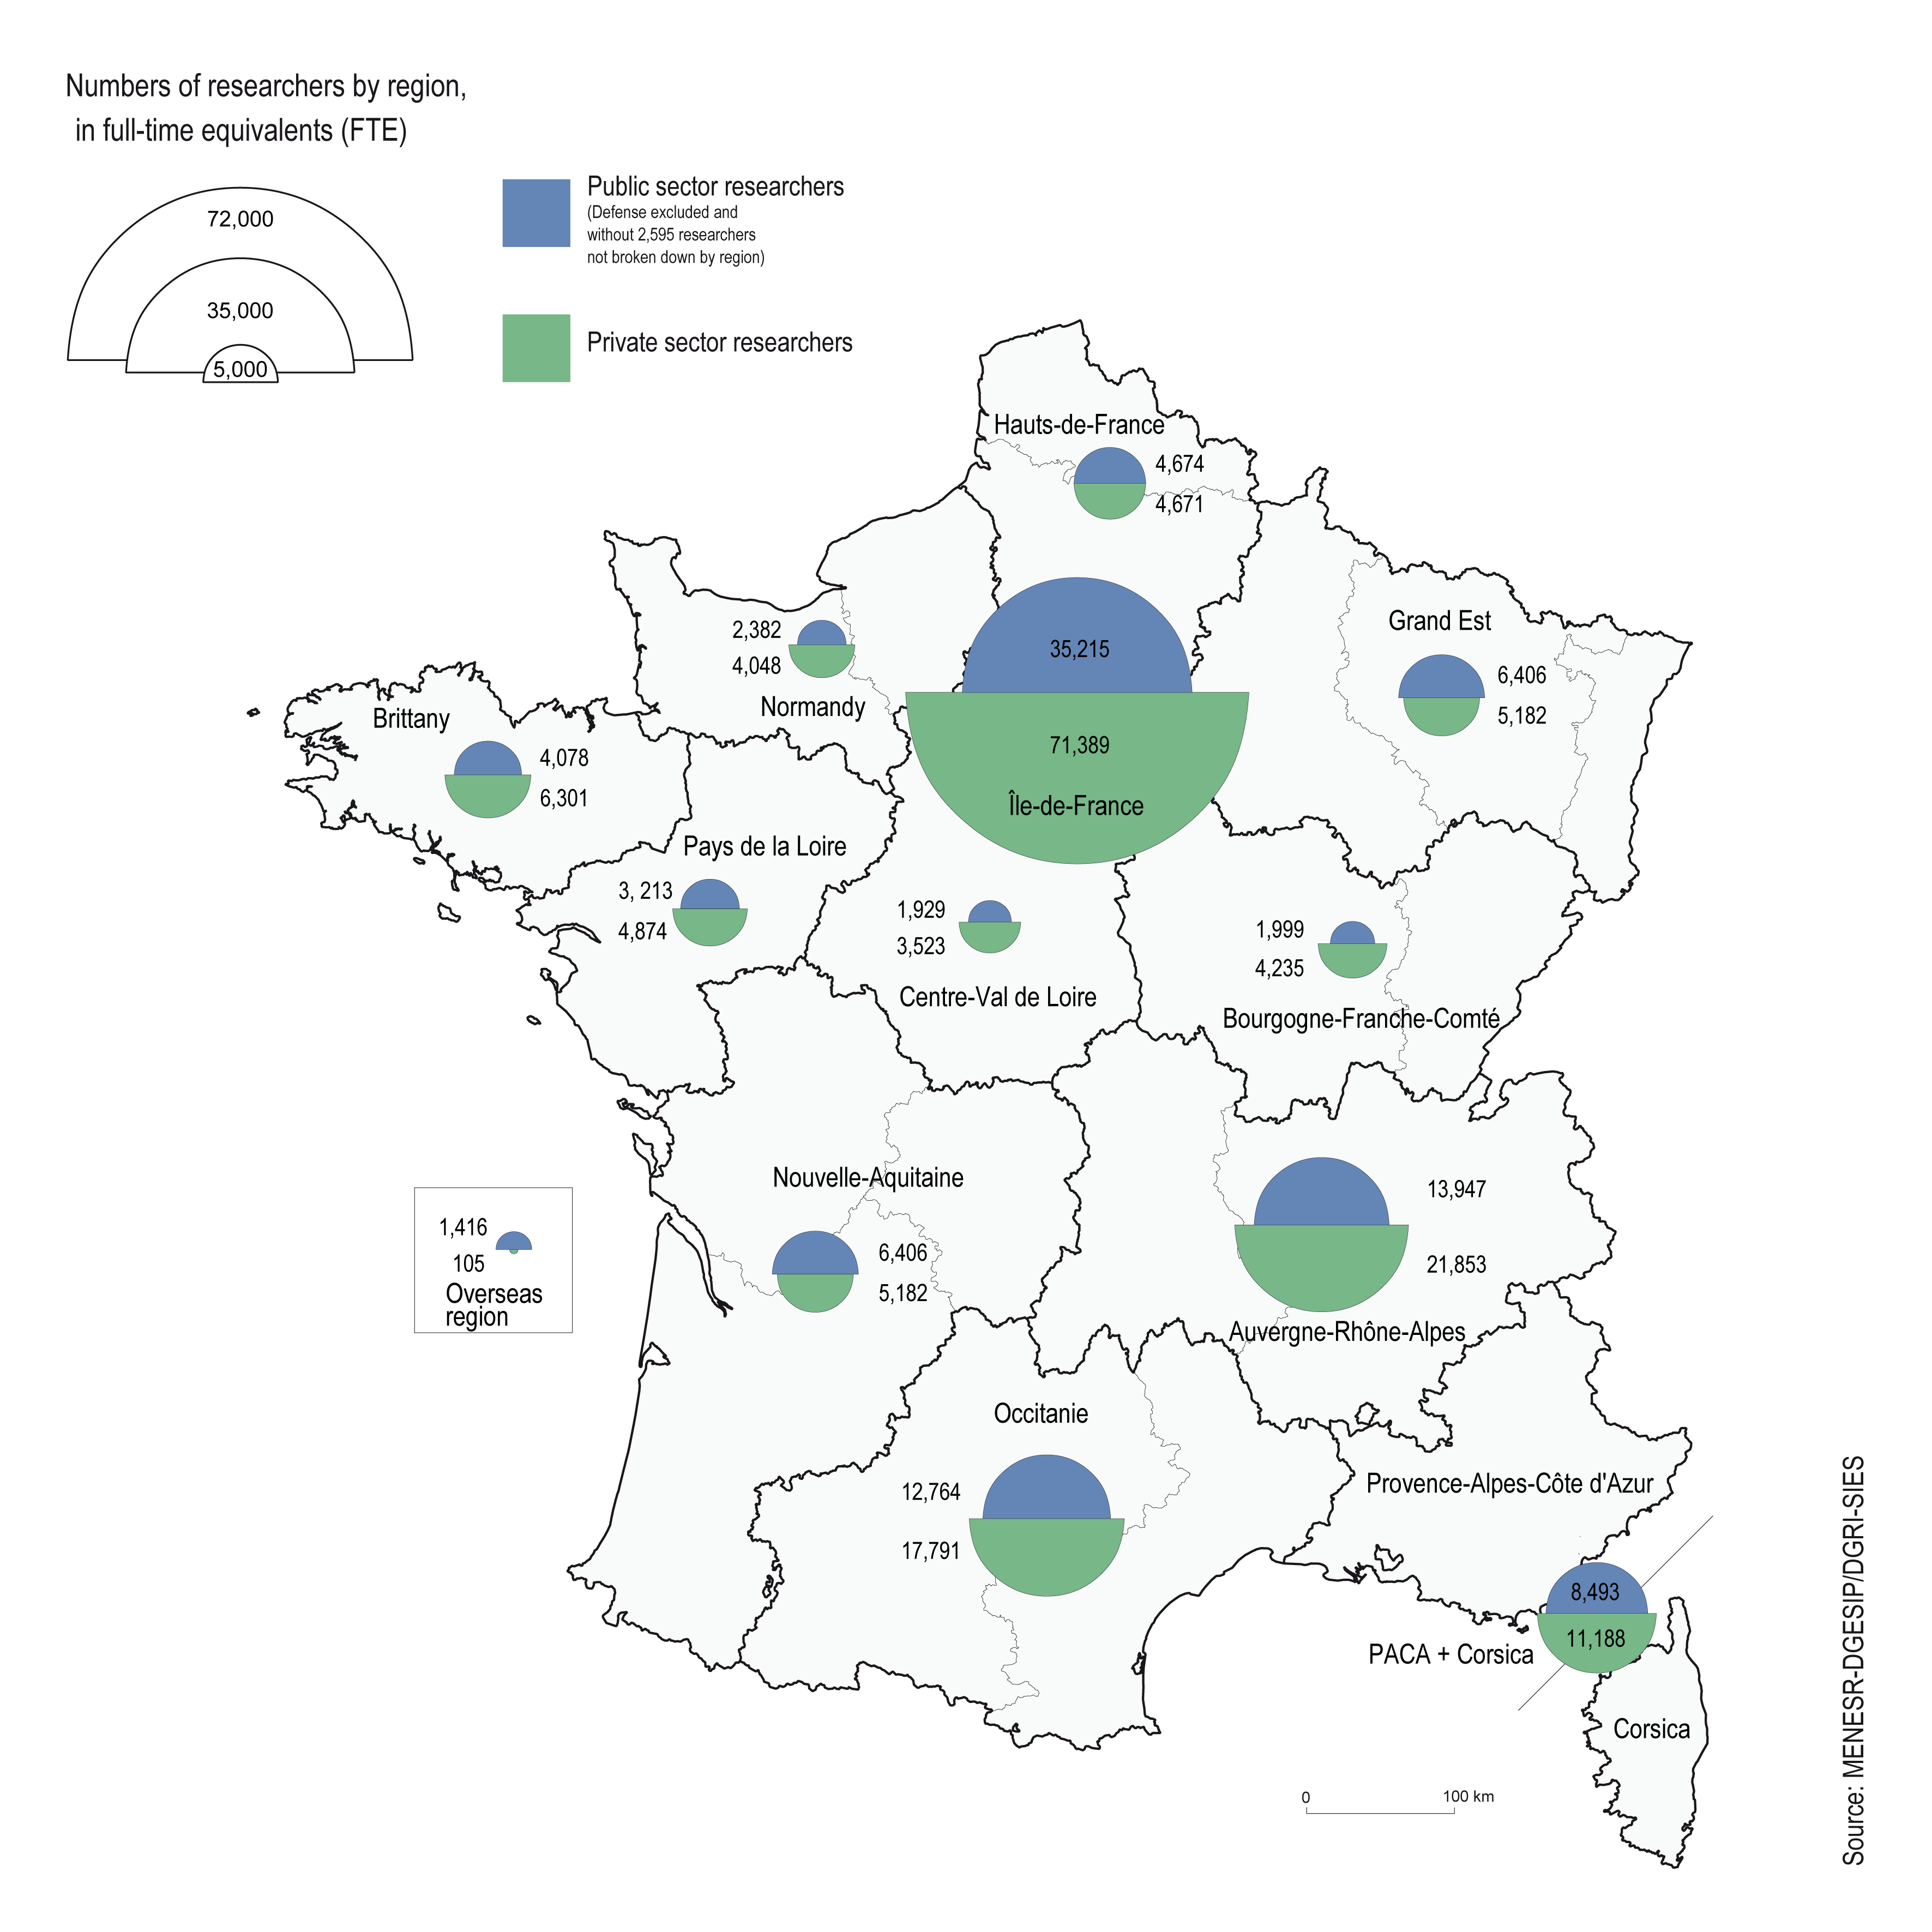
In 2014, nearly 575,300 people, encompassing researchers and supporting staff, were involved in R&D-related activities in some capacity, accounting for just over 417,000 full-time equivalent (FTE) positions. The number of researchers rose sharply between 2009 and 2014 (+ 14.6%) to 266,700 FTE researchers (6,000 more FTE positions than in 2013). This increase was more marked among businesses (+ 21%) than in government (+ 5.9%). In 2014, 61% of researchers worked for businesses. In the business enterprise sector, nearly half of all researchers worked in just 5 industry groups: ‘Computer-related and information service activities’, ‘Manufacture of motor vehicles’, ‘Specialised scientific and technical activities’, ‘Manufacture of air and spacecraft and related machinery’ and ‘Manufacture of instruments and appliances for measuring, testing and navigation; watches and clocks'. The increase in the number of R&D personnel was largely driven by the service sector, where the number of people working in R&D rose 4 times more quickly than in the industrial sector. If we compare the number of researchers against the active population, France had 9.3 researchers for every 1,000 working people in 2014, fewer than South Korea and Japan, but more than Germany, the United States and the United Kingdom.
The proportion of women working in R&D was 30% in 2014 and was lower in the business enterprise sector (22%) than in government (42%). The proportion of women working as researchers (26%) was also lower than that of women working as supporting staff (38%). An engineering diploma was the most advanced qualification held by more than half of all researchers working in the business enterprise sector in 2014, while only 12% of researchers in this sector held a PhD. In addition to this, 30% of the PhD graduates working in the business enterprise sector also held an engineering diploma.
Scientific publications and patent registrations are two key measurable indicators that can be used to assess a country’s R&D activities. International competition in these two areas is fierce.
In a context of a sharp increase in the number of publications between 2005 and 2015, France was placed seventh in terms of global share of scientific publications. The number of its publications and their impact index are rising but its global share of scientific publications is narrowing under the effect of new countries arriving on the international scientific stage such as China, India and Brazil. It thus dropped from 4.4% to 3.3%% of global publications between 2005 and 2015. The United Kingdom and Germany are ranked higher than France at European level. Spain and Italy are enjoying a significant increase in the number and impact of their scientific publications and are now catching up with France.
More than one French publication in two is produced in conjunction with foreign scientists, which places the rate of French co-publications among the highest in the world (comparable with the United Kingdom or Germany). One quarter of French publications include American scientists, for example.
In 2015, France showed a balanced profile in terms of fields of education qualified by major specialisation in mathematics. France stood out clearly from the United Kingdom and United States, which specialise more in Human and Social Sciences, and the more divergent Asian countries, as they are highly specialised in some fields of education and very little in others. French biomedical research lay seventh globally, with nearly 20,000 publications in 2015. The number of publications has increased in the last decade but, driven by the dynamic expansion of emerging countries, France's global share in biomedical research publications has been contracting, as has the impact index of its publications.
France is also a major player in patents. In 2014, France was in fourth place globally in the European patent system (6.3%% of applications lodged). Its specialist fields include 'transport', 'nanotechnologies, microstructures', 'organic fine chemistry', 'materials, metallurgy' and 'ecotechnology'.
France's share of worldwide patents has however been in decline since the mid-2000s, both under the European system and in the United States, due to the emergence of new countries such as China and South Korea.
France received 10.6% of the financial contribution allocated by the European Union for the Horizon 2020 programme, making it the third largest beneficiary behind Germany and the United Kingdom. The position held by France in the European technological research and development programmes is tending to weaken. It received 11.5% of grants allocated during FP7. This share has been a weaker point since the beginning of the H2020 programme.
How to cite this paper :
close
01 Students enrolled in higher education in the 2015-16 academic year
You can embed this map to your website or your blog by copying the HTML code and pasting it into the source code of your website / blog:
close
02 Numbers of researchers in 2014
You can embed this map to your website or your blog by copying the HTML code and pasting it into the source code of your website / blog:
close
Translation
 Etat de l'enseignement supérieur et de la rechercheL'état de l'Enseignement supérieur et de la Recherche en France n°10 - Avril 2017
l'état de l'Enseignement supérieur et de la recherche - résumé - Emmanuel Weisenburger
