Higher Education and Research in France, Facts and Figures - Summary
The 8th edition of Higher Education and Research in France, Facts and Figures presents an annual overview, backed up by figures, of developments within the French system, its resources and outcomes. Wherever the data permit, an international comparison is provided. A double page is devoted to each theme (49 in total), including a summary of the main data available and several graphs and tables as illustrations. This publication relies on key national and international statistical sources providing data on higher education and research in France.
Increased expenditure on higher education
In 2013, the French nation spent €28.7 billion on higher education, an increase of 1.2% in comparison with 2012 (at constant prices, i.e. adjusted for inflation). Expenditure on higher education has more than doubled since 1980 (by a factor of 2.5, at constant prices), increasing by an average of 2.8% a year. In 2013, average expenditure per student in higher education totalled €11,540, 40% more than in 1980. It was equivalent to the average spending for a student in a general or technical secondary school (€10,960 in 2013). However, the cost per student varied between different types of courses, ranging from €10,850 per year on average for students at state-run universities to €14,850 for those attending classes preparing for admission to Grandes Écoles. This variation is explained in large part by the level of educational supervision provided.
Staffing costs accounted for more than two thirds of expenditure on higher education. At the start of the 2013-14 academic year, the teaching and research potential in public higher education institutions under the responsibility of the Ministry of Education, Higher Education and Research (Ministère de l’éducation nationale, de l’enseignement supérieur et de la recherche – MENESR) was 91,800 teachers, which included 57,000 teacher-researchers and equivalent, or 62% of all staff. Secondary teachers working in higher education and non-tenured teachers represented 14% and 24% of the teaching workforce respectively. The number of teachers working in higher education has increased by nearly 5% in ten years.
The French government provides the majority of funding for higher education, accounting for around 70% of financing in 2013, while households contributed just under 9%. At the start of the 2013-14 academic year, more than 660,000 students benefited from direct financial aid in the form of grants or loans. Financial and social support for students, including accommodation subsidies and forms of tax relief, totalled €6.0 billion, as compared with €3.5 billion in 1995 (at constant prices).
In 2011, France devoted 1.5% of its GDP to higher education, leaving it one tenth of a percentage point below the average for OECD countries (1.6%) and far behind Canada (2.8%), the United States (2.7%) and South Korea (2.6%).
Student numbers at record levels thanks to a broader range of courses on offer at private higher education institutions
625,650 of the candidates who sat examinations in 2014 were awarded a baccalauréat, equivalent to a pass rate of 88%. The proportion of people in a generation that hold a baccalauréat was over 60% in 1995 and rose to 77% in 2014.
Almost all of those with general baccalauréats and 74% of those with technological baccalauréats were enrolled on higher education courses at the start of the 2013-14 academic year. Most of those with vocational baccalauréats went straight into employment, so the proportion of this group enrolling in higher education was lower. However, it has nonetheless risen sharply in ten years (to 33% in 2013, as compared with 17% in 2000, excluding alternance programmes). Nearly 75% of those who obtained a baccalauréat (of any kind) in 2013 went on to enrol on higher education courses immediately (excluding alternance programmes). A significant number, particularly among those with vocational baccalauréats, also continued on to higher education via alternance programmes.
Given the proportion of an age group that is now obtaining a baccalauréat, and the percentage that are continuing secondary education, it follows that nearly 60% of young people are now accessing higher education.
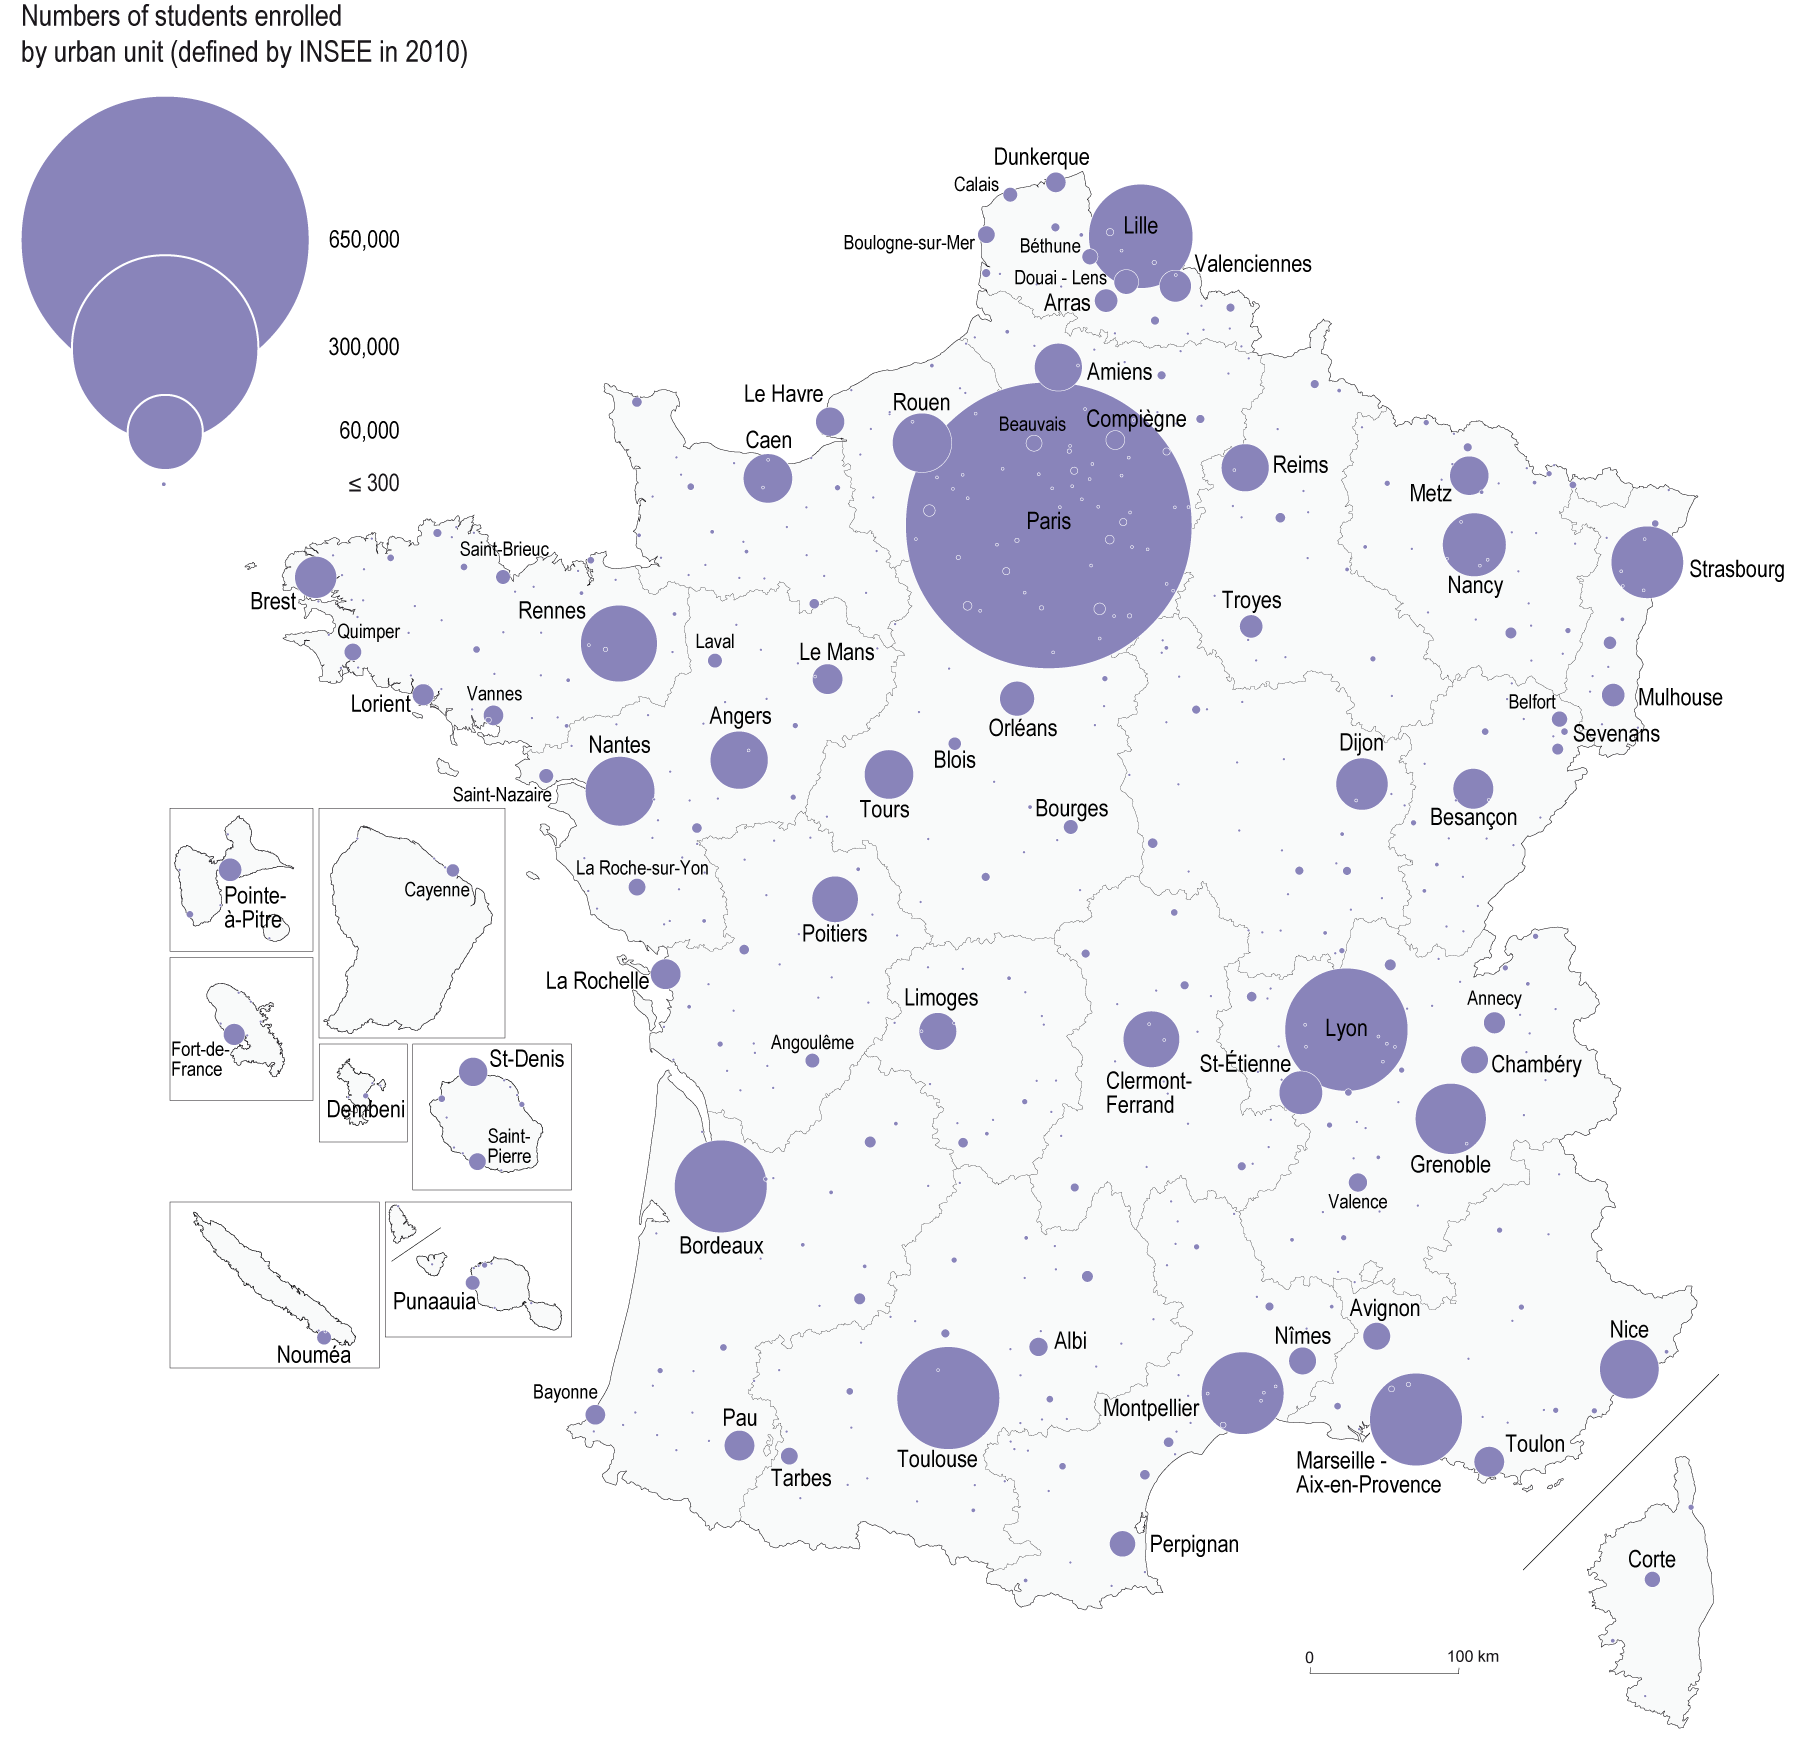
At the start of the 2013-14 academic year, 2,430,100 students were enrolled in higher education. This represents an increase of 1.8% on the previous academic year, meaning that the number of students has never been so high, despite the fact that there are slightly fewer young people of studying age. This is explained by the fact that higher education in France now holds greater appeal for both young French nationals with baccalauréats and foreign students (who accounted for more than 12% of students in 2013). Since the early 2000s, private higher education institutions have seen the highest increase in student numbers (+ 50% between 2000 and 2012).
The overwhelming majority of those with general baccalauréats go on to university, many of whom enrol on general or healthcare courses. The most popular choices other than university programmes are vocational short courses at Technological university institutes (Instituts universitaires de technologie – IUT) or higher technical sections (Sections de techniciens supérieurs – STS) and CPGEs.
The appeal of university education varies significantly between different disciplines. In the ten years between 2004 and 2013, the number of students enrolling on healthcare courses has risen sharply (+ 30.0%). Law courses have also seen a sharp increase (+ 18.9%). Student numbers have recently returned to their 2004 levels in scientific subjects and physical education and sports science and techniques, having been in decline over the intervening decade. The number of students in the arts and human and social sciences, which together account for more than half of all students enrolled at university on general courses, fell slightly between 2004 and 2013 (- 5.5%).
Alternance programmes were first introduced in 1987 and were expanded as part of reforms to the French higher education system (‘LMD reform’) in 2002, consequently becoming much more widespread in higher education. The number of apprentices increased by 92% between 2005 and 2012 and by 10% over the last year alone. 135,400 apprentices were enrolled on alternance programmes in 2012, accounting for 5.5% of all students in higher education. Nearly half of all apprentices were working towards a higher technical certificate (Brevet de technicien supérieur – BTS), while one in ten were preparing for an engineering diploma or Bachelor’s degree.
PhDs are the most advanced qualification awarded by higher education institutions and doctoral research contracts provide many PhD students with their first professional experience. PhD graduates are a key driving force behind research in France. Training through research has been provided by graduate schools since 2000. Students are normally required to prepare a thesis over a three-year period, although they sometimes take longer than this, particularly in human and social sciences. Nearly 13,000 PhDs were awarded in 2012. Although the number of PhD students increased by 3% between the 2000-2001 and 2013-2014 academic years, it has been in decline in recent years. However, the number of PhDs awarded rose by 54% between the 2001 and 2012 sessions, with the recent fall in enrolments seemingly offset by greater numbers of students completing their thesis within shorter periods of time. Most of the PhDs awarded (60%) were in scientific subjects.
Variations in pass rates between different types of courses
The pass rates for certain higher education qualifications were strongly influenced by students’ academic backgrounds. This was true of general Bachelor’s degrees, University technology diplomas (Diplômes universitaires de technologie – DUT) and BTSs. Those with general baccalauréats were likely to do better on these courses than their counterparts with technological or vocational baccalauréats. Among those with general baccalauréats, students who had achieved a grade higher than a ‘Pass’ in their baccalauréat were more likely to do well on these courses. However, the type of baccalauréat held by students had little influence on the pass rate for vocational Degrees, which was high: 88.0% of students enrolled obtained their qualification in one year. By contrast, only 44.5% of students on Bachelor’s degree programmes obtained their qualification in 3, 4 or 5 years. 69% of DUT students and 60% of those working towards a BTS obtained their qualification in two years.
The trajectories of students enrolled on CPGEs in scientific or business subjects showed significant levels of success. After two or three years, eight out of ten baccalauréat holders who had previously attended CPGEs in scientific or business subjects were enrolled on a baccalauréat + 5 years-level programme at a Grande École. A growing proportion of students who had attended CPGEs in the arts (a third of those who obtained a baccalauréat in 2008) were enrolled on a baccalauréat + 5 years-level programme at a Grande École after 3 years. This trend is explained by the increasing opportunities offered by the humanities test bank (Banque d’épreuves littéraires – BEL) and the fact that Grandes Écoles have diversified the ways in which they recruit students. However, given the small number of places offered at Grandes Écoles through competitive entrance examinations, the majority of arts students still went on to university (two thirds of students had enrolled after two or three years), with most entering the third year without having fallen behind on a university degree course.
In the 5th year after obtaining their baccalauréat, 72% of students enrolled at STSs and 89% of those enrolled at IUTs had obtained a higher education qualification, 22% and 52% (respectively) with a baccalauréat + 3 years-level qualification (marking the successful conclusion of three years of higher education following the baccalauréat). Nearly three quarters of those who were awarded a general Bachelor’s degree stayed on at university the following year to do a Master’s degree, although the situation varied between subject areas. 87% of law graduates and nearly 80% of science graduates went on to start a Master's degree. However, the proportion of students going on to study for a Master's degree was lower in other subject areas (between 64% and 71%). Of those who enrolled in the first year of a Master’s degree programme in 2009-10, 57% ultimately obtained their Master’s degree in either 2 or 3 years.
In 2013, 44% of young people aged between 25 and 29 held a higher education qualification. Despite this, and even though this proportion is significantly lower than the average for OECD countries, 19% of baccalauréat holders who start higher education still leave without obtaining a qualification (nearly 75,000 young people every year).
Higher education is becoming more accessible to students from all social backgrounds and to women, but there remain significant differences between those from different social backgrounds, as well as between courses
The drive to make higher education more widely accessible continues: in 2013, 60% of those aged between 20 and 24 had attended higher education courses (regardless of whether they graduated), as compared with 32% of those aged between 45 and 49.
This increase was observed among students from all social backgrounds. 79% of those aged 20-24 who came from more privileged backgrounds and whose parents worked as managers or technicians and associated professionals were studying or had studied at a higher education institution, as compared with 58% of those aged between 45 and 49. This increase was slightly higher among those whose parents were manual workers or employees, but from a particularly low starting point: 46% of those aged 20-24 were studying or had studied at higher education institutions, as compared with 20% of those aged between 45 and 49.
The two-to-one ratio between the two social groups also holds true for qualifications: on average, over the period 2011-2013, 65% of those whose parents worked as managers or technicians and associated professionals held a higher education qualification, as compared with 30% of those whose parents were manual workers or employees.
Although there was little distinction in terms of social background on technological short courses, such as BTSs and DUTs, divisions were much more noticeable in the case of universities (excluding IUTs) and Grandes Écoles. 30% of those whose parents worked as managers graduated from a Grande École or university with a baccalauréat + 5 years-level or higher qualification, as compared with only 7% of those whose parents were manual workers.
More than half of students (55%) are women. Women make up the vast majority (70%) of those studying arts or human sciences subjects, as well as paramedical and social care courses (84%). However, they are in the minority when it comes to the most selective courses, such as CPGEs and IUTs, and still account for only a very small proportion of students on science courses. In 2013-14, just over a quarter of students (27%) at engineering schools were women, despite an increase of 5 percentage points over the previous 15 years. The proportion of women doing apprenticeships is also low.
Women account for a larger share of the student population and more women hold qualifications than men. While 46% of a given generation have a higher education qualification, the figure is over 50% for women (51%), but only 40% for men. The labour market is less favourable for women and their trajectories towards access to employment are slower. They are less likely to have open-ended employment contracts and more likely to work part time. More specifically, 3 years after leaving higher education, a quarter of women are employed as managers, compared with more than a third of men.
Over the past 10 years, the number of women working as teacher-researchers has increased. In 2013-14, women held a third of all teacher-researcher posts and 43.6% of all lecturing positions, but still only accounted for 22.5% of university professors.
A higher education qualification remains an advantage in getting a job and pursuing a career
Those leaving higher education enjoy more favourable conditions in accessing the labour market than other applicants, particularly in times of crisis. They are less exposed to unemployment, although this varies depending on their level of educational attainment, specialism and the type of programme they attended.
A study on the occupational integration of young people with DUTs, vocational degrees and Master’s degrees 30 months after graduation, and analyses of the occupational integration after 3 years of young people leaving the education system have shown that a higher education qualification offers a certain degree of protection against unemployment.
In 2013, only 13% of all those who left higher education in 2010 were unemployed, as compared with a quarter of all young people who left higher education without obtaining a qualification. However, the situation varied considerably depending on the type of qualification. The rate of unemployment for those with baccalauréat + 2 years-level or baccalauréat + 3 years-level qualifications in engineering or healthcare was very low (3% and 2% respectively) 3 years after they had left higher education. The unemployment situation for other graduates was certainly less favourable, but nonetheless confirmed the protection afforded by a higher education qualification.
The general perception that a higher education qualification offers a certain degree of protection against unemployment was confirmed by an increase in the proportion of those who had left higher education resuming their studies within 3 years of finishing their initial education. 16% of young graduates and nearly a third of those who left higher education without obtaining a qualification resumed studies within 3 years of finishing their initial education. This is nearly double the percentage recorded in the late 1990s.
Increased funding for R&D against a backdrop of intense global competition
In 2012, France’s gross domestic expenditure on R&D (GERD) totalled €46.5 billion, equivalent to 2.23% of the country’s gross domestic product (GDP), putting it behind South Korea (4.4%), Japan (3.4%), the United States (2.7%) and Germany (3.0%), but ahead of the United Kingdom (1.7%). GERD is expected to reach €47 billion (2.23% of GDP) in 2013.
The research effort came largely from businesses, which carried out 65% of all R&D conducted in France in 2012 and financed 59% of this work. Public sector GERD totalled €16.5 billion in 2012, with R&D carried out in large part by dedicated research institutions (55%), as well as higher education institutions (40%). Intramural business enterprise expenditure on R&D (BERD) stood at €30.1 billion in 2012. SMEs accounted for 86% of firms carrying out R&D in France in 2012 and contributed 16% of GERD, more than half of which was invested in the service sector. Large enterprises, which accounted for 59% of GERD, focused three quarters of their funding on high and medium-high technologies. More than 50% of all intramural BERD went towards six industry groups: ‘Manufacture of motor vehicles’, ‘Manufacture of air and spacecraft and related machinery’, ‘Manufacture of basic pharmaceutical products and pharmaceutical preparations’, ‘Manufacture of chemicals and chemical products’, ‘Manufacture of instruments and appliances for measuring’ and ‘Manufacture of electronic components and boards, computers and peripheral equipment’. Businesses also devoted a considerable proportion of their intramural BERD to multidisciplinary fields such as new materials, nanotechnology, biotechnology and environmental R&D.
Around a third of firms are deemed to be ‘technologically innovative’ and, of these, 70% carry out R&D. Institutions that carry out public research collaborate with 14% of technologically innovative firms, which are the most active in research, accounting for 70% of BERD. These firms mainly belong to the ‘Scientific and technical activities’ and ‘Manufacturing industries’ sectors.
The government helps businesses in their research effort by means of direct funding, collaborations with dedicated civil or military state research institutions and tax incentives such as the R&D tax credit (Crédit d’impôt recherche – CIR) and ‘young innovative company’ (YIC) status. In 2012, 6% of all business R&D was government-funded and the amount of CIR paid out totalled €5.3 billion. In this regard, France is no different from other OECD countries, where tax incentives are increasingly being used to promote R&D in the private sector, reflecting the more intense competition between different countries when it comes to attracting firms’ R&D divisions. Local authorities also contribute to the research effort, often by financing property transactions and technology transfers. The 2013 research and technology transfer (R&T) budget for local authorities was estimated to be €1.3 billion.
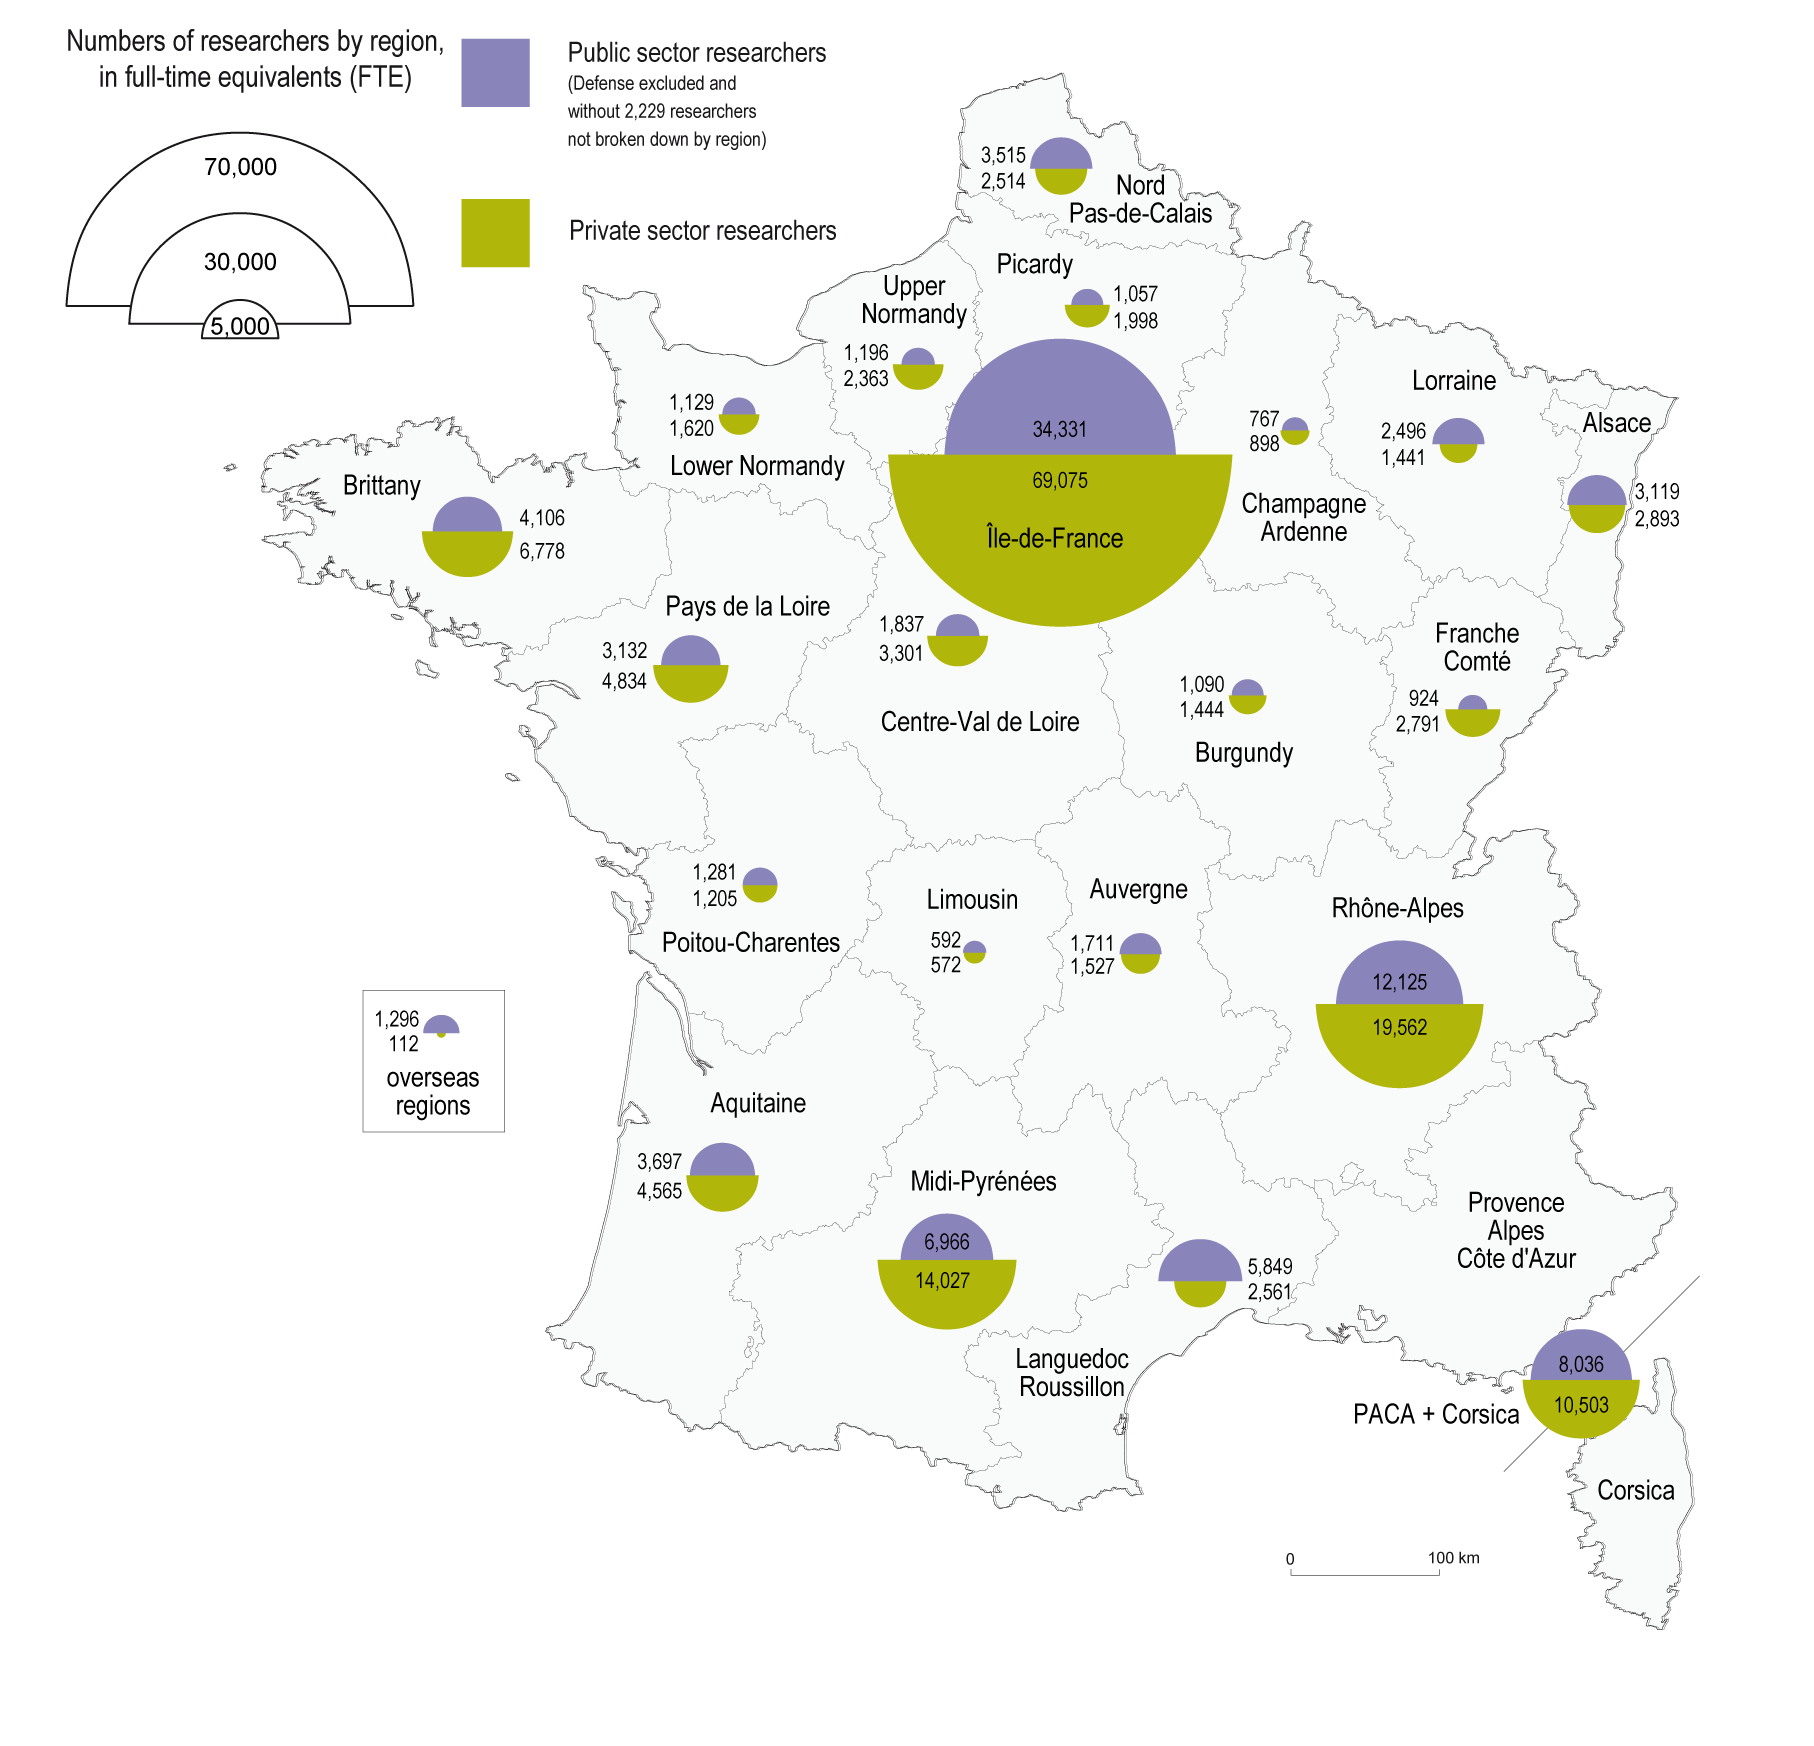
In 2012, nearly 564,500 people, encompassing researchers and supporting staff, were involved in R&D-related activities in some capacity, accounting for just over 412,000 full-time equivalent (FTE) positions. The number of researchers rose sharply between 2007 and 2012 (+ 16.8%) to 259,100 FTE researchers (10,000 more FTE positions than in 2011), putting France in 2nd place within the European Union behind Germany and just ahead of the United Kingdom. This increase was more marked among businesses (+ 26%) than in government (+ 5%). In 2012, 60% of researchers worked for businesses. In the business enterprise sector, nearly half of all researchers worked in just 5 industry groups (‘Manufacture of motor vehicles’, ‘Computer-related and information service activities’, ‘Professional, scientific and technical activities’, ‘Manufacture of air and spacecraft and related machinery’, ‘Manufacture of basic pharmaceutical products and pharmaceutical preparations’ and ‘Manufacture of instruments and appliances for measuring’). The increase in the number of R&D personnel was largely driven by the service sector, where the number of people working in R&D rose 10 times more quickly than in the industrial sector.
The proportion of women working in R&D was 29% in 2012 and was lower in the business enterprise sector (22%) than in government (40%). The proportion of women working as researchers (26%) was also lower than that of women working as supporting staff (35%). An engineering diploma was the most advanced qualification held by more than half of all researchers working in the business enterprise sector in 2011 and only 12% of researchers in this sector held a PhD. In addition to this, a third of the PhD graduates working in the business enterprise sector also held an engineering diploma. The majority of PhD graduates went on to work in public research: 5 years after obtaining their PhD, half of all PhD graduates were working in public research, as compared with a quarter in the private sector. The remaining quarter worked in other types of roles and reported being less satisfied with their employment and receiving lower pay.
Scientific publications and patent registrations are two key measurable indicators that can be used to assess a country’s R&D activities. International competition in these two areas is fierce. In 2013, France was ranked 6th in the world in terms of its share of worldwide scientific publications (3.5%). Its share of citations after two years in later publications (which reflects their impact on scientific advancement more effectively than simply measuring the number of publications produced) was 3.9%. These two shares have been in decline since 1999, due in large part to the arrival of new countries on the global scientific scene, such as China, India and Brazil. This decline can also be observed among France’s major European counterparts. While their share of publications is falling, their impact indexes are increasing and exceed the global average. The breakdown of French publications by subject area is generally balanced compared with other countries, although it does reveal a marked specialisation in mathematics.
France is also well-placed internationally as regards patents. In 2012, France was ranked 4th in the world in the European patent system, with 6.4% of applications recorded, and 7th in the world in the United States system, with 2.1% of patents granted. Its specialist fields include ‘Transport’, ‘Micro-structural and nano-technology’, ‘Organic fine chemistry’, ‘Engines, pumps, turbines’, ‘Civil engineering’, ‘Pharmaceuticals’ and ‘Materials, metallurgy’.
France’s share of worldwide patents has been in decline in both systems since 2004 due to the emergence of new countries such as China and South Korea.
France received 11.5% of the financial contribution allocated by the European Union for the 7th Framework Programme for Research and Technological Development (FP7), making it the third largest beneficiary behind Germany and the United Kingdom. Nuclear, space and aeronautics are its strongest sectors under this programme, but its position has declined, due in large part to a weaker engagement among French participants.
How to cite this paper :
close
01 Students enrolled in higher education in the 2013-14 academic year
You can embed this map to your website or your blog by copying the HTML code and pasting it into the source code of your website / blog:
close
02 Numbers of researchers in 2012
You can embed this map to your website or your blog by copying the HTML code and pasting it into the source code of your website / blog:
close
Translation
 Etat de l'enseignement supérieur et de la rechercheL'état de l'Enseignement supérieur et de la Recherche en France n°8 - juin 2015
l'état de l'Enseignement supérieur et de la recherche - Résumé - Emmanuel Weisenburger
